How to reconstruct discrete ancestral character states on nodes in your tree using Arbor
In this exercise, we will learn how to reconstruct ancestral character states in Arbor for a discrete character - that is, a character that can take on one of a number of discrete values. Examples might be lizards, “legs” versus “no legs” - this would be a two-state discrete character. Another example would be animal locomotion - “walks,” “swims,” or “flies.” This is an example of a three-state discrete character.
Imagine that you have a phylogenetic tree with information on some discrete character for some or all of the tips. You want to use mathematical methods to reconstruct the ancestral character states on the internal nodes of the tree. Then, this is the exercise for you!
Loading example data
You will need the anolis example data files, anolis.phy and anolis.csv, from Arbor datasets. Save those files somewhere on your computer.
Now open the Arbor web app. Drag and drop the two anolis data files on the blue “Browse or drop files” box to load them into your browser.
Finally, log in and create a personal collection.
Selecting the collections that you need
For this example, everything required is in the “phylogeny” collection - so click on that eyeball and you will be able to access the functions that you need.
At this point, you should have the two anolis datafiles stored in Arbor and the “phylogeny” collection available. You should be logged in and have write access to your own private collection.
Set up your workflow
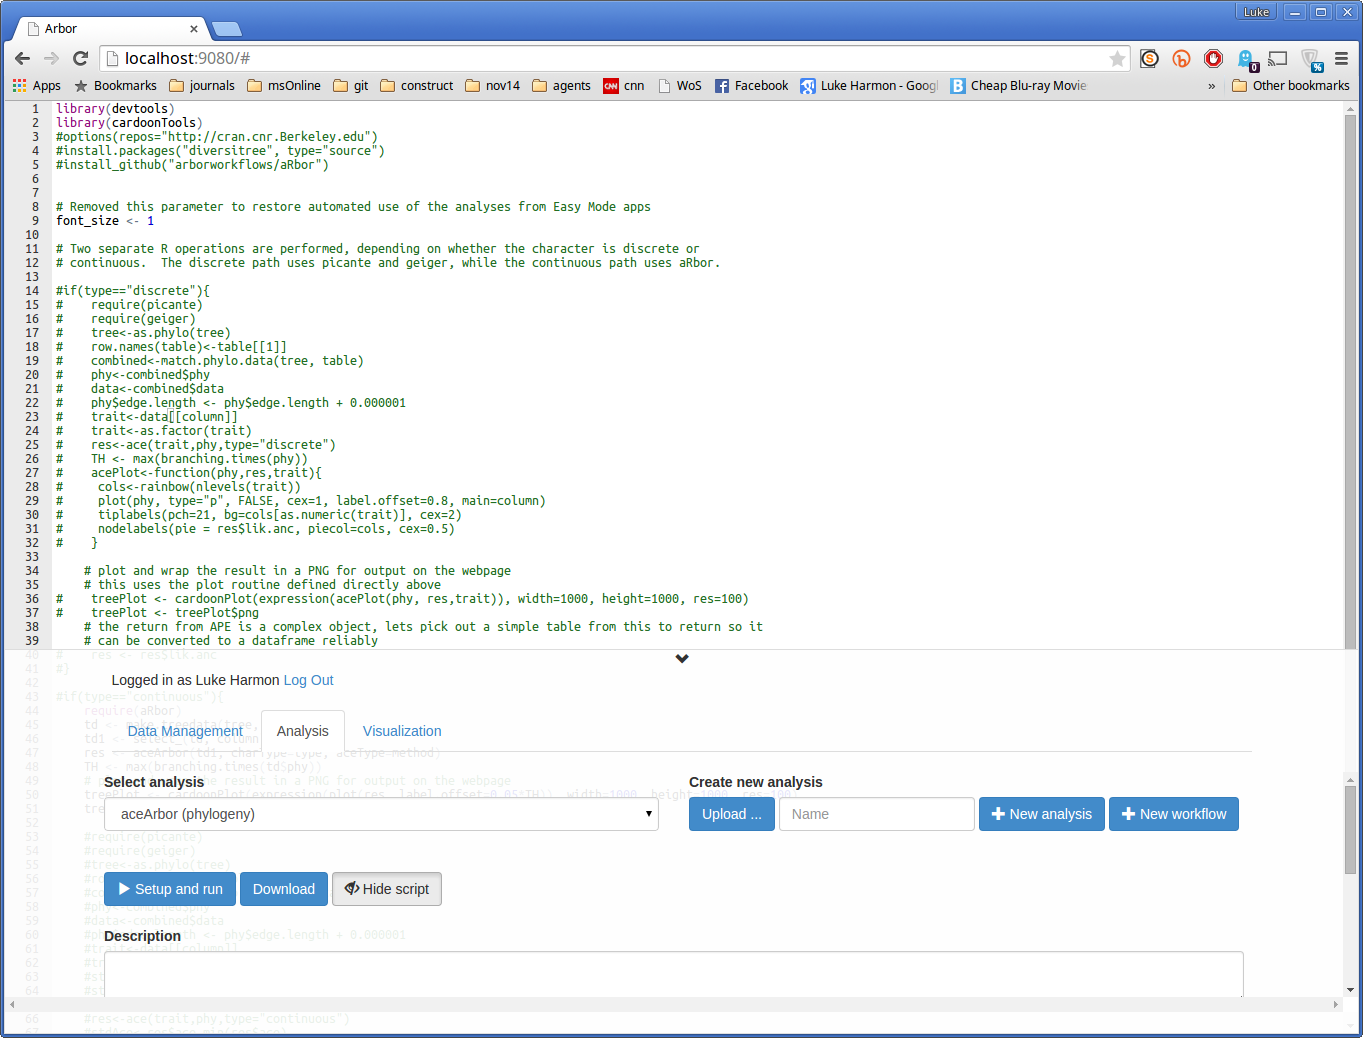
The main function in Arbor for ancestral state reconstruction is aceAcbor in the “phylogeny” collection. Select that function now. You can view the source code for it by choosing “show script” (it is in R).
You will need to use this function in a workflow to calculate ancestral states and return the output. To start, create a new workflow called “DiscreteAncestralStatesWorkflow”. Make sure to choose “New workflow” and not “New analysis”!
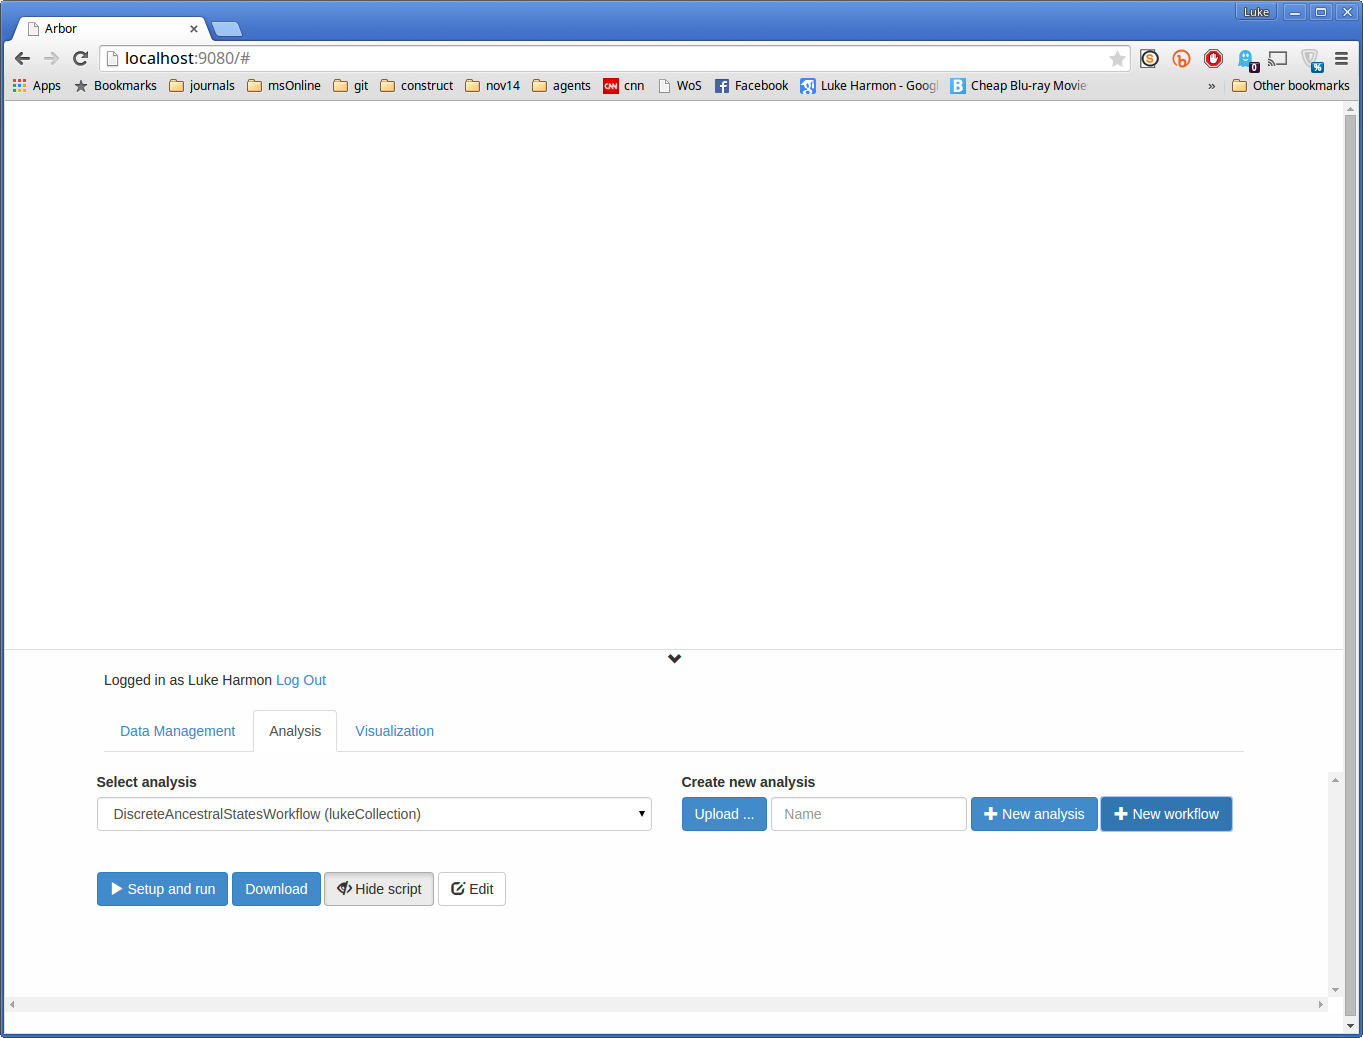
Now create the connections you need to make the workflow run. First, click the “edit” button to start working on the workflow.
Now add the aceArbor function by selecting it under “Select analysis.” When you click “Add to workflow” then the function shoud appear in your workspace.
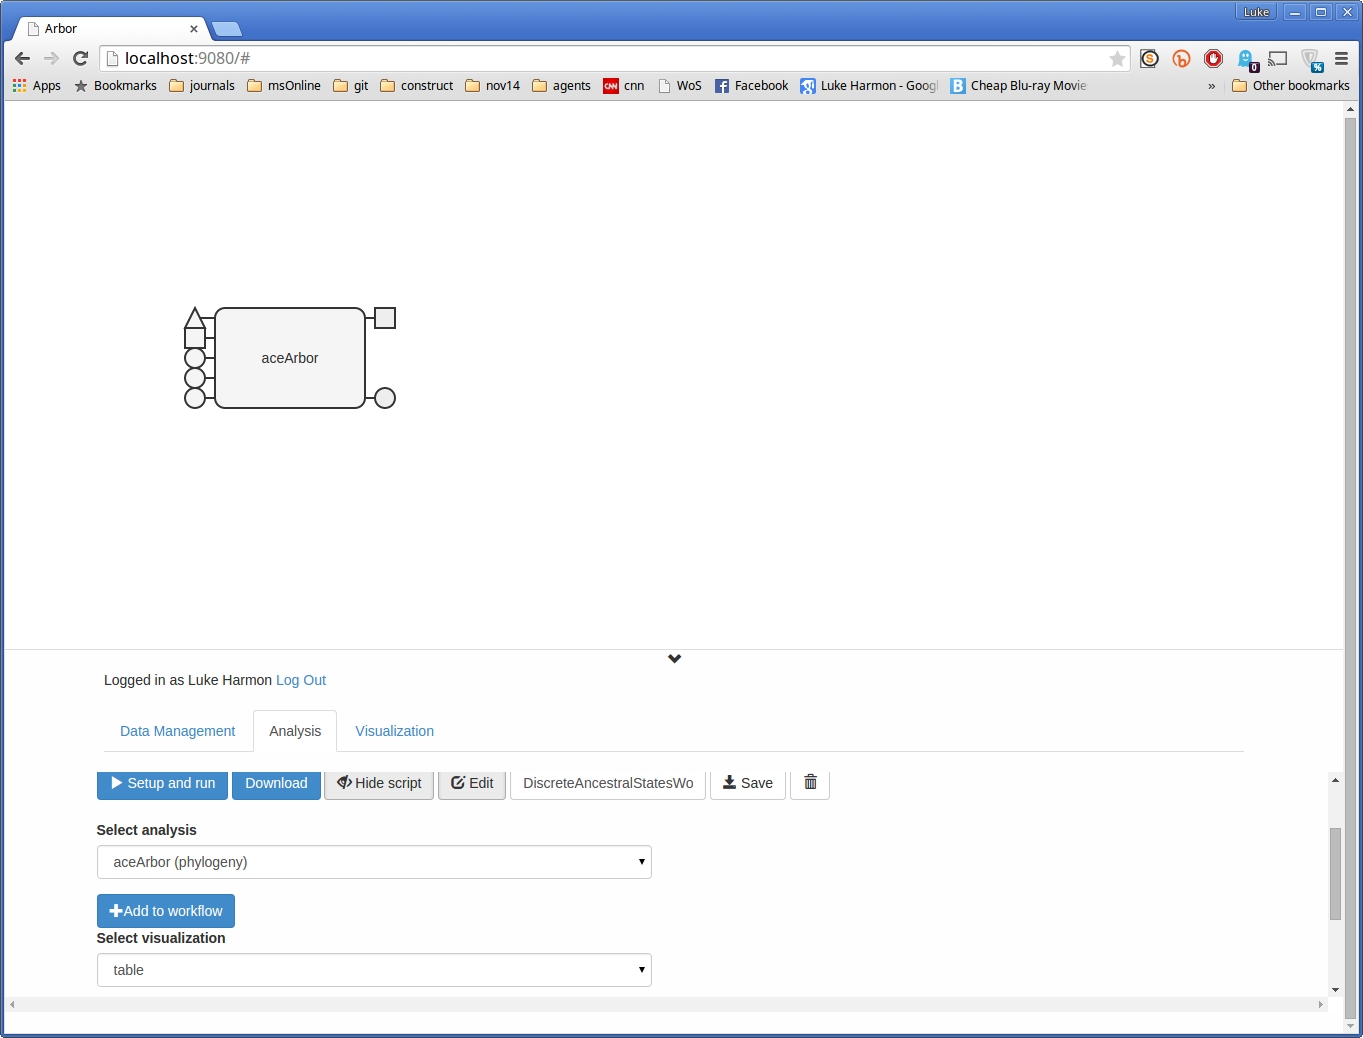
Now create the inputs and outputs of the function by clicking on the “spokes” coming out of aceArbor. You should also move the blocks around to make your workflow look nice.
Final result:
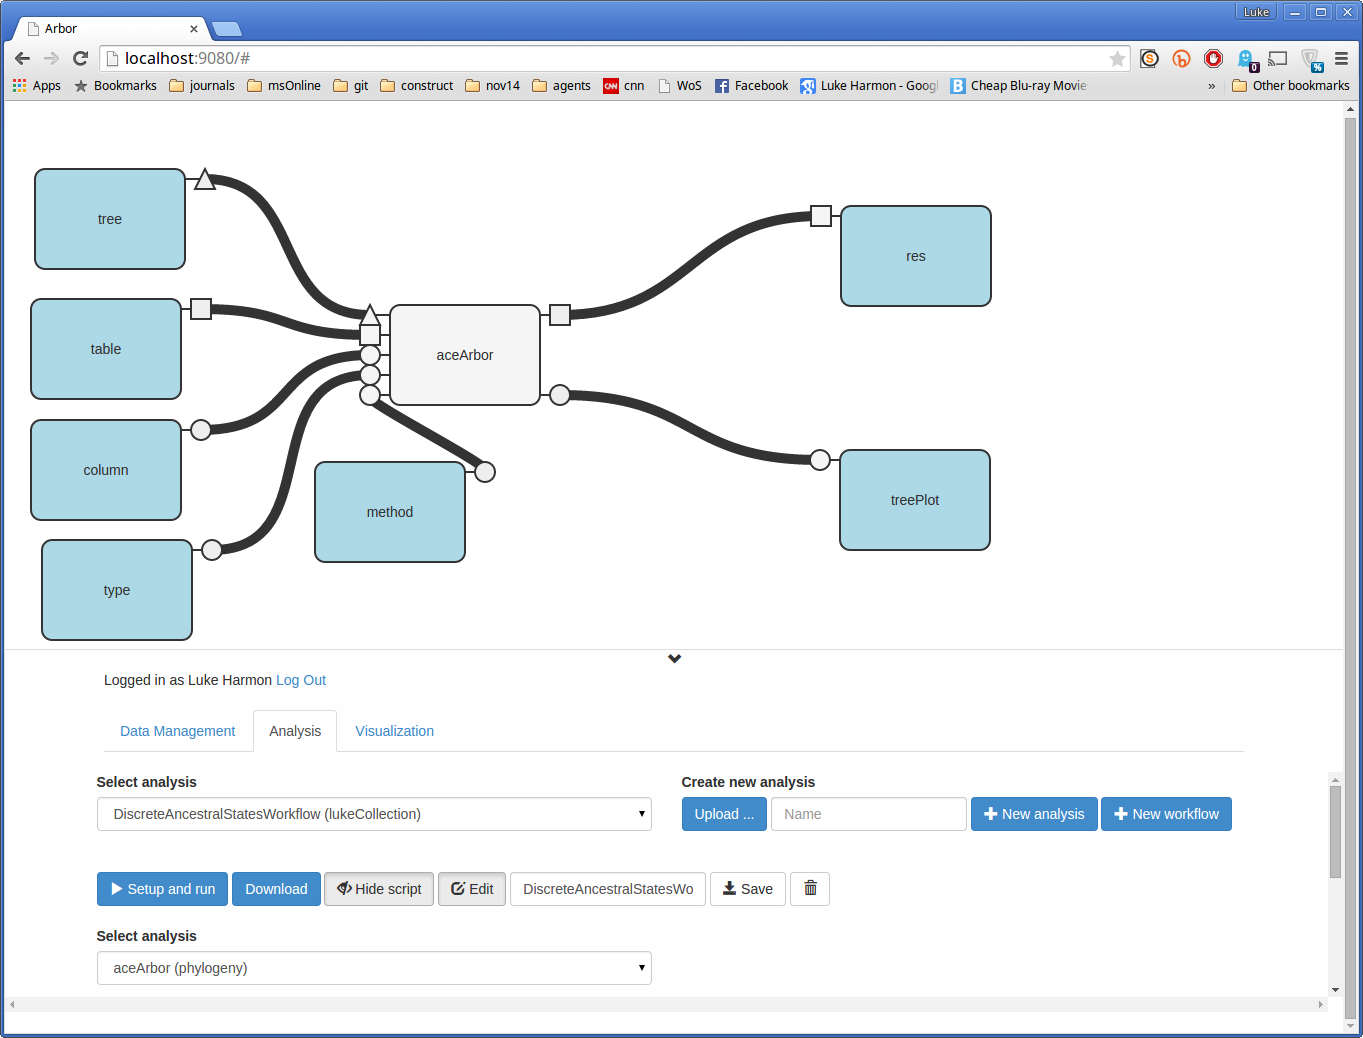
Once you have a workflow that looks the way you want, click save! If you do not do this you will be running the workflow at the last point it was saved and not what is shown on the screen.
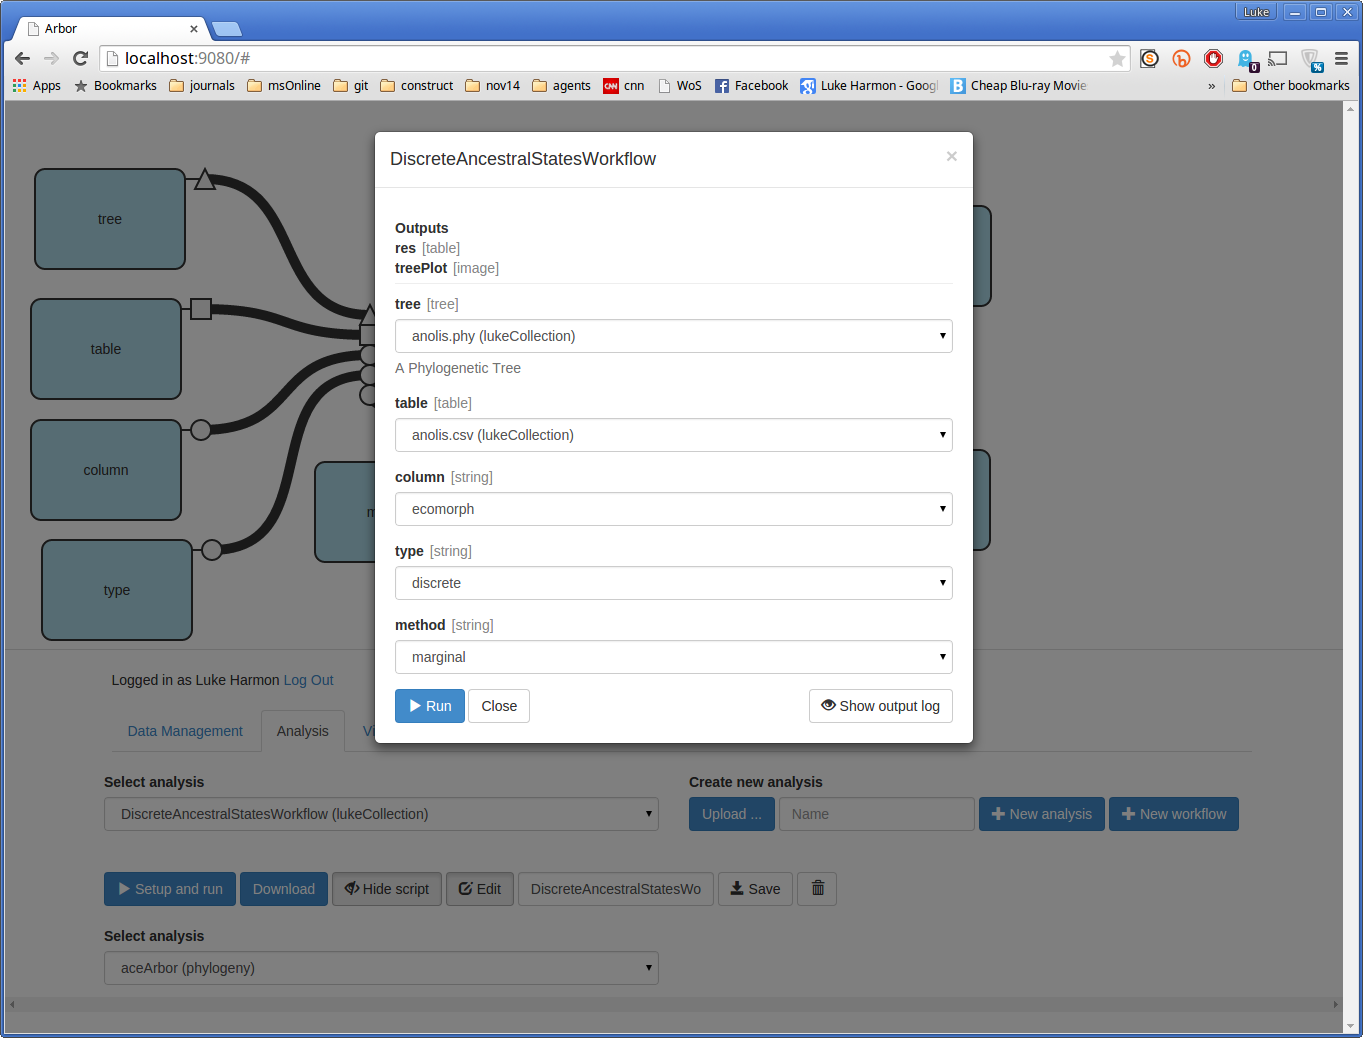
Run your workflow
Click “Setup and run” to run your workflow. Select these options:
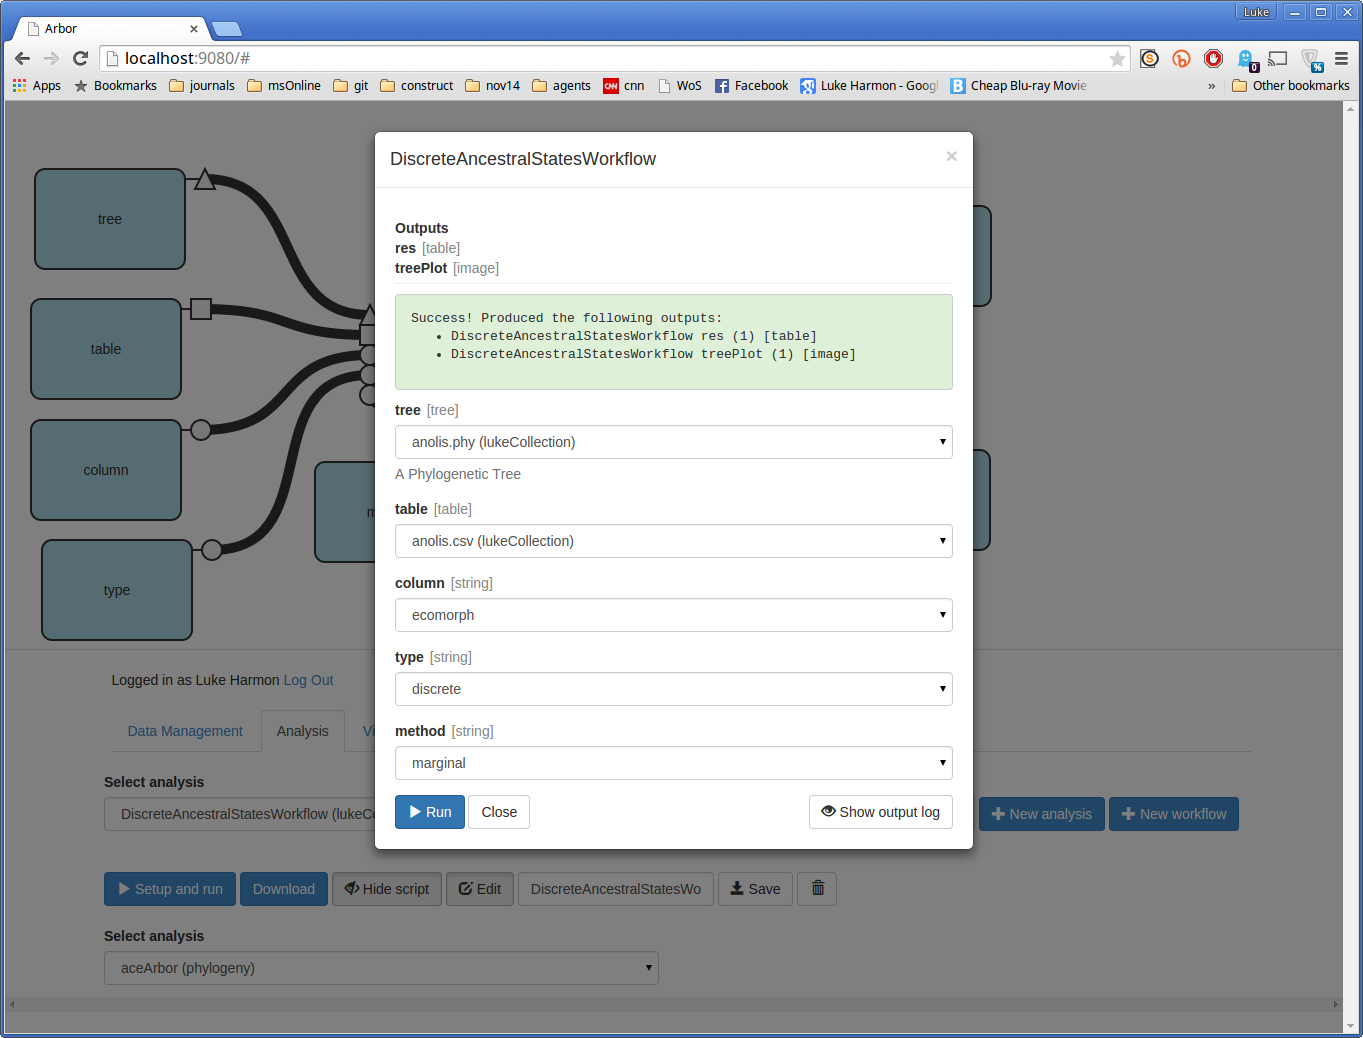
If your analysis worked, you should see the following message:
See your results
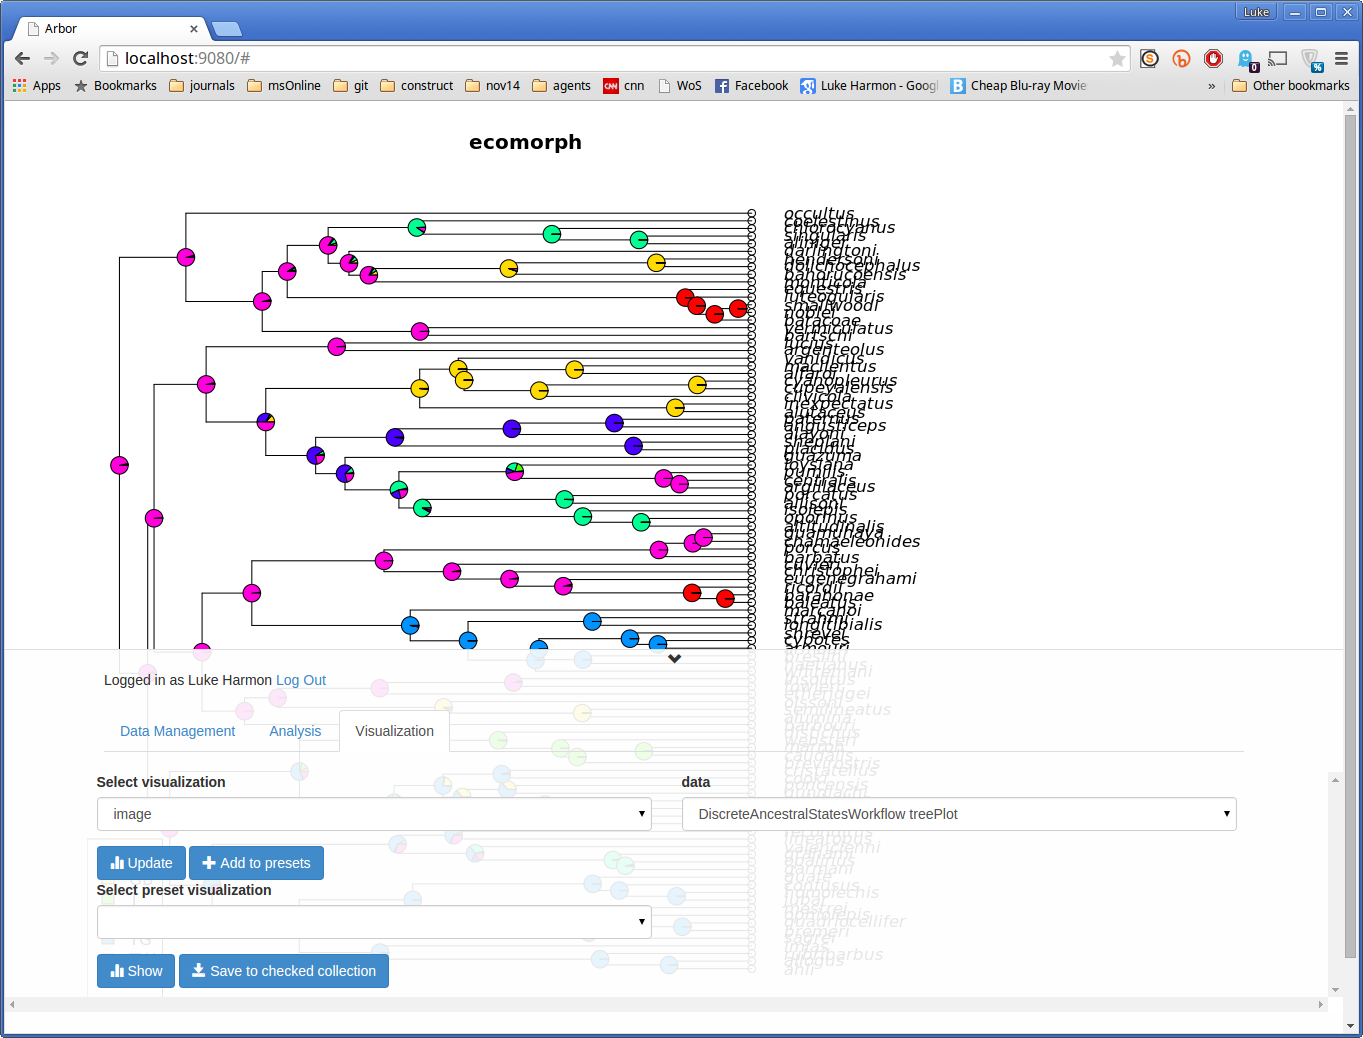
Now move over to the “visualization” tab to see your results. First, select “image” under “Select visualization”, and choose your tree plot under “data” (it should be called DiscreteAncestralStatesWorkflow treePlot). Click “update” to see this result:
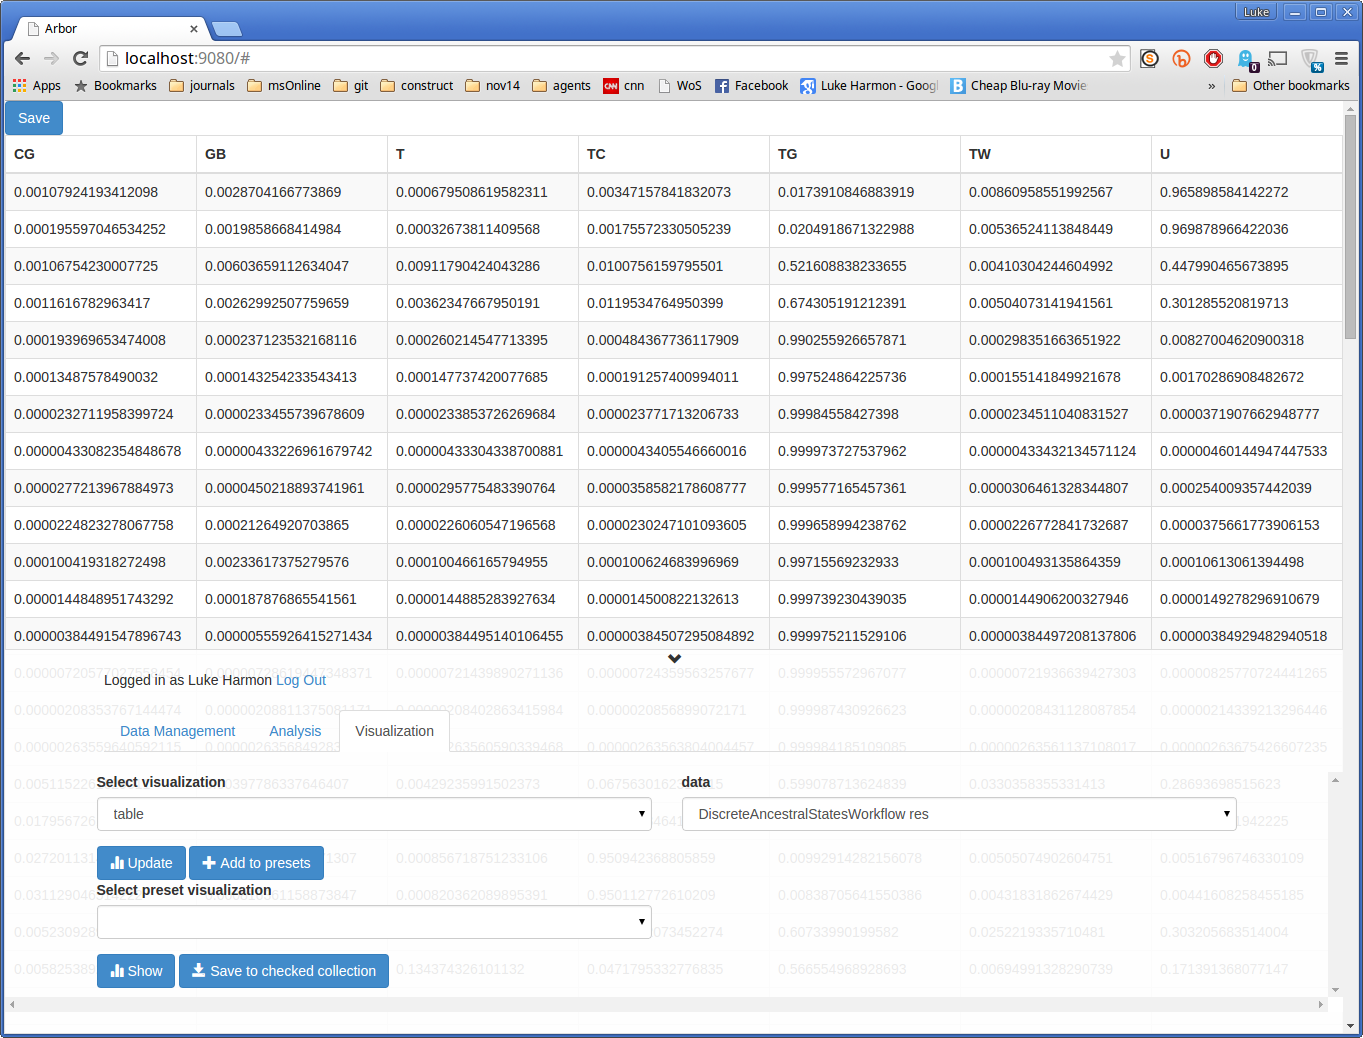
To see the results in table format, choose “table” and “DiscreteAncestralStatesWorkflow res”. Update gives you this table, which is presently useless. Sorry!