Use R package ‘spider’ to analyze species delimitation and test for reciprocal monophyly.
This tutorial will guide the user through the spider workflow. Spider is an R package that includes several useful tests for DNA barcoding studies that are not contained in other comparative method-focused R packages. Documentation on Spider can be found at https://CRAN.R-project.org/package=spider.
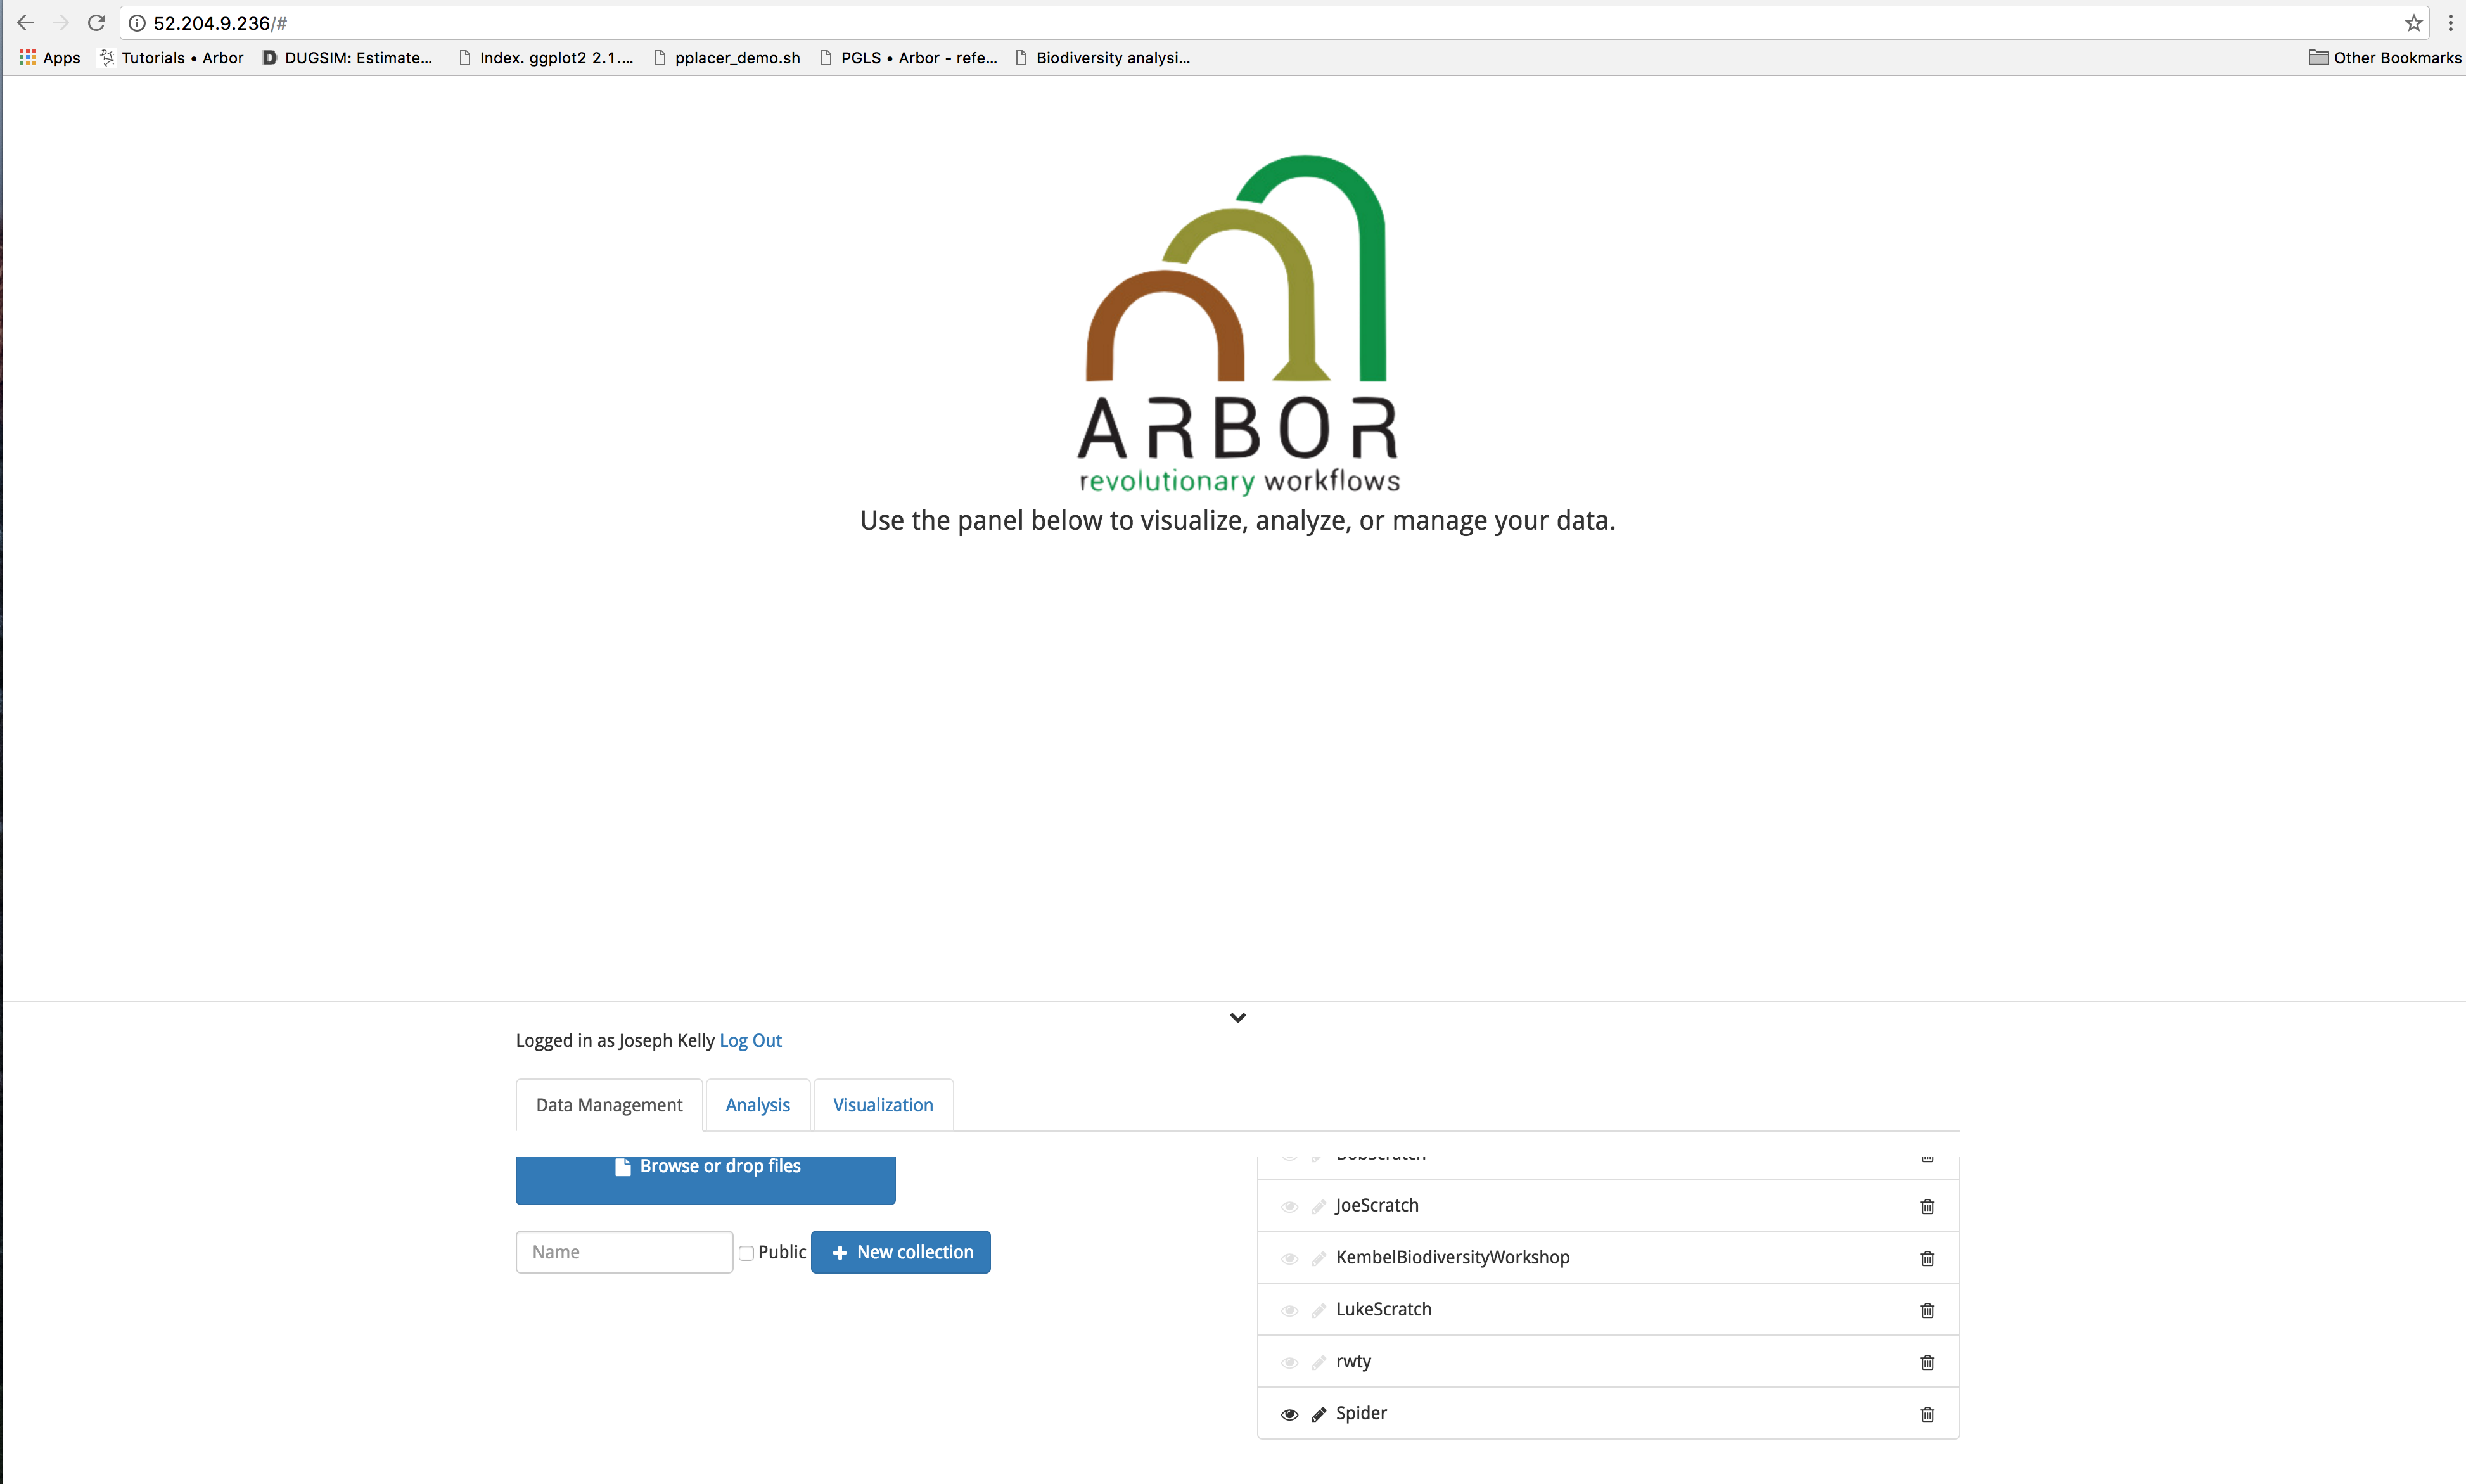
The Arbor instance we will be using for this tutorial can be reached at http://52.204.9.236/. To prepare for the tutorial, sign in using your username and password and highlight the eyeball icon next to the Spider directory.
Load the example data
Species delimitation projects using molecular information require a multiple sequence alignment, with each species represented by many sequences. This tutorial will use a Spheniscus alignment that was prepared using publicly available sequences from GenBank, and aligned using the program Geneious v9.0.5. This file is saved in the Arbor program, and is called ‘Spheniscus_seqs_arbor.csv (Spider)’. If you wish to download and view the file, select ‘Spheniscus_seqs_arbor.csv (Spider)’ from the dropdown list at the bottom of the Arbor homepage and click the download button.

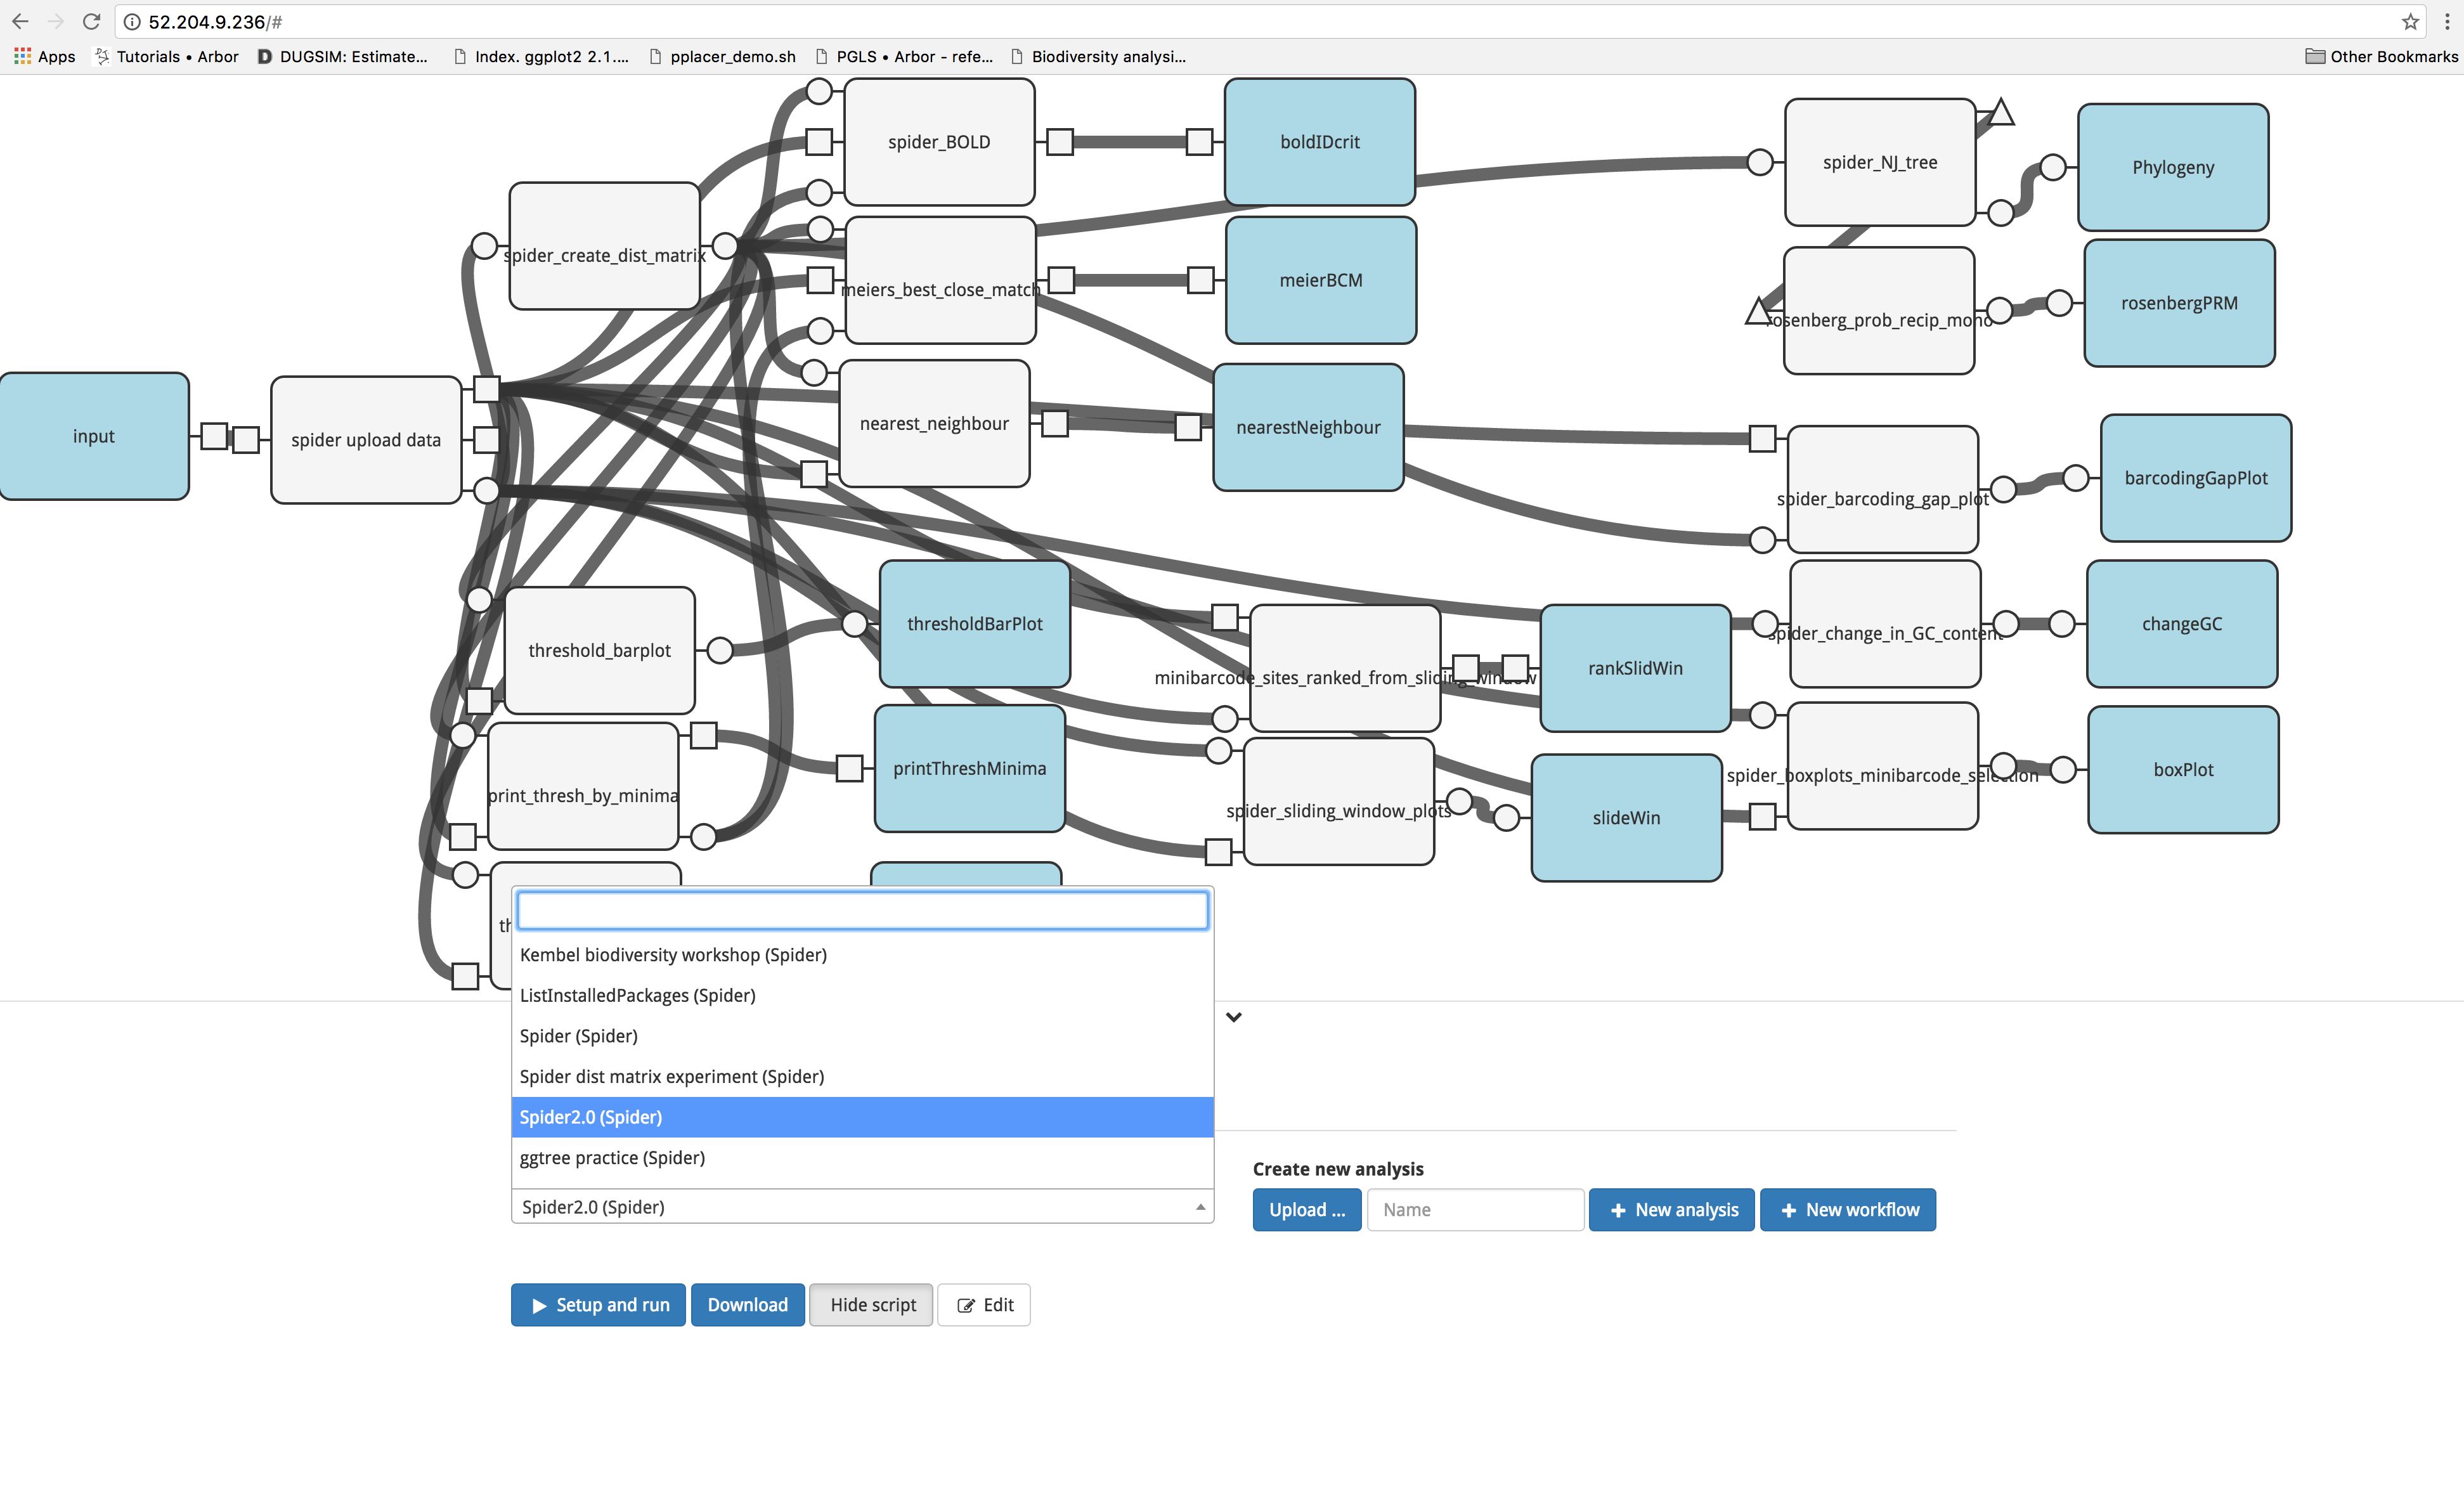
Run the Spider workflow
A preassembled workflow has been constructed in Arbor. To access it, click on the ‘Analysis’ tab, then select ‘Spider2.0’ from the dropdown menu.
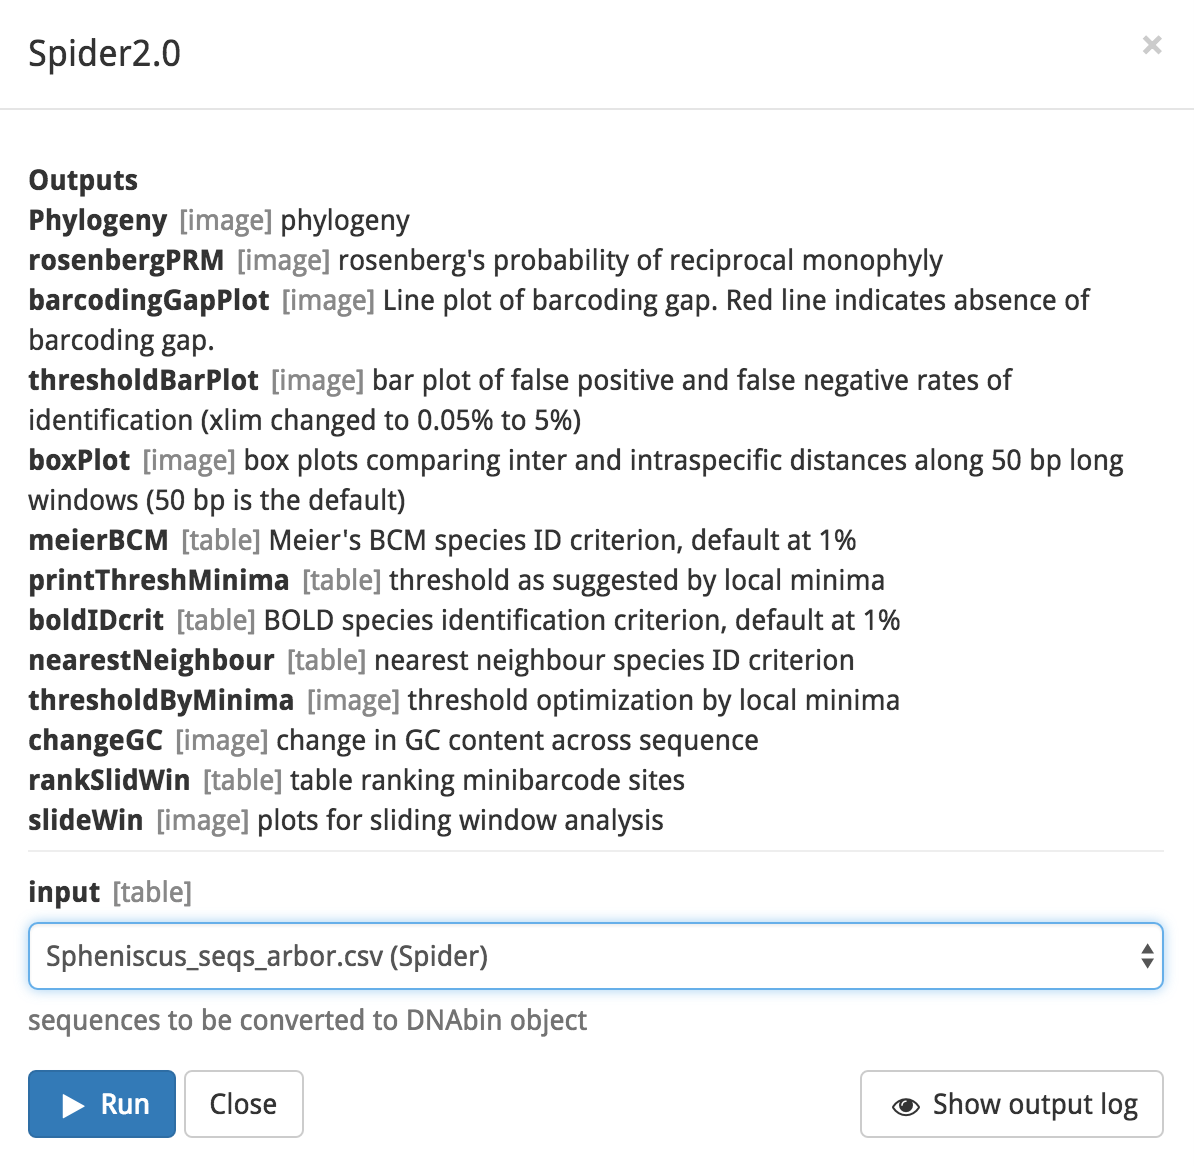
Next, click on the blue ‘Set up and run’ button. You will see a popup box listing the outputs of the modules in your workflow. Note the gray text next to the output; it denotes the format of the output. For example, Phylogeny’s output will be formatted as an image. In the middle of the box, select the input file ‘Spheniscus_seqs_arbor.csv’ from the dropdown menu. To start the analysis, click the blue ‘Run’ button.
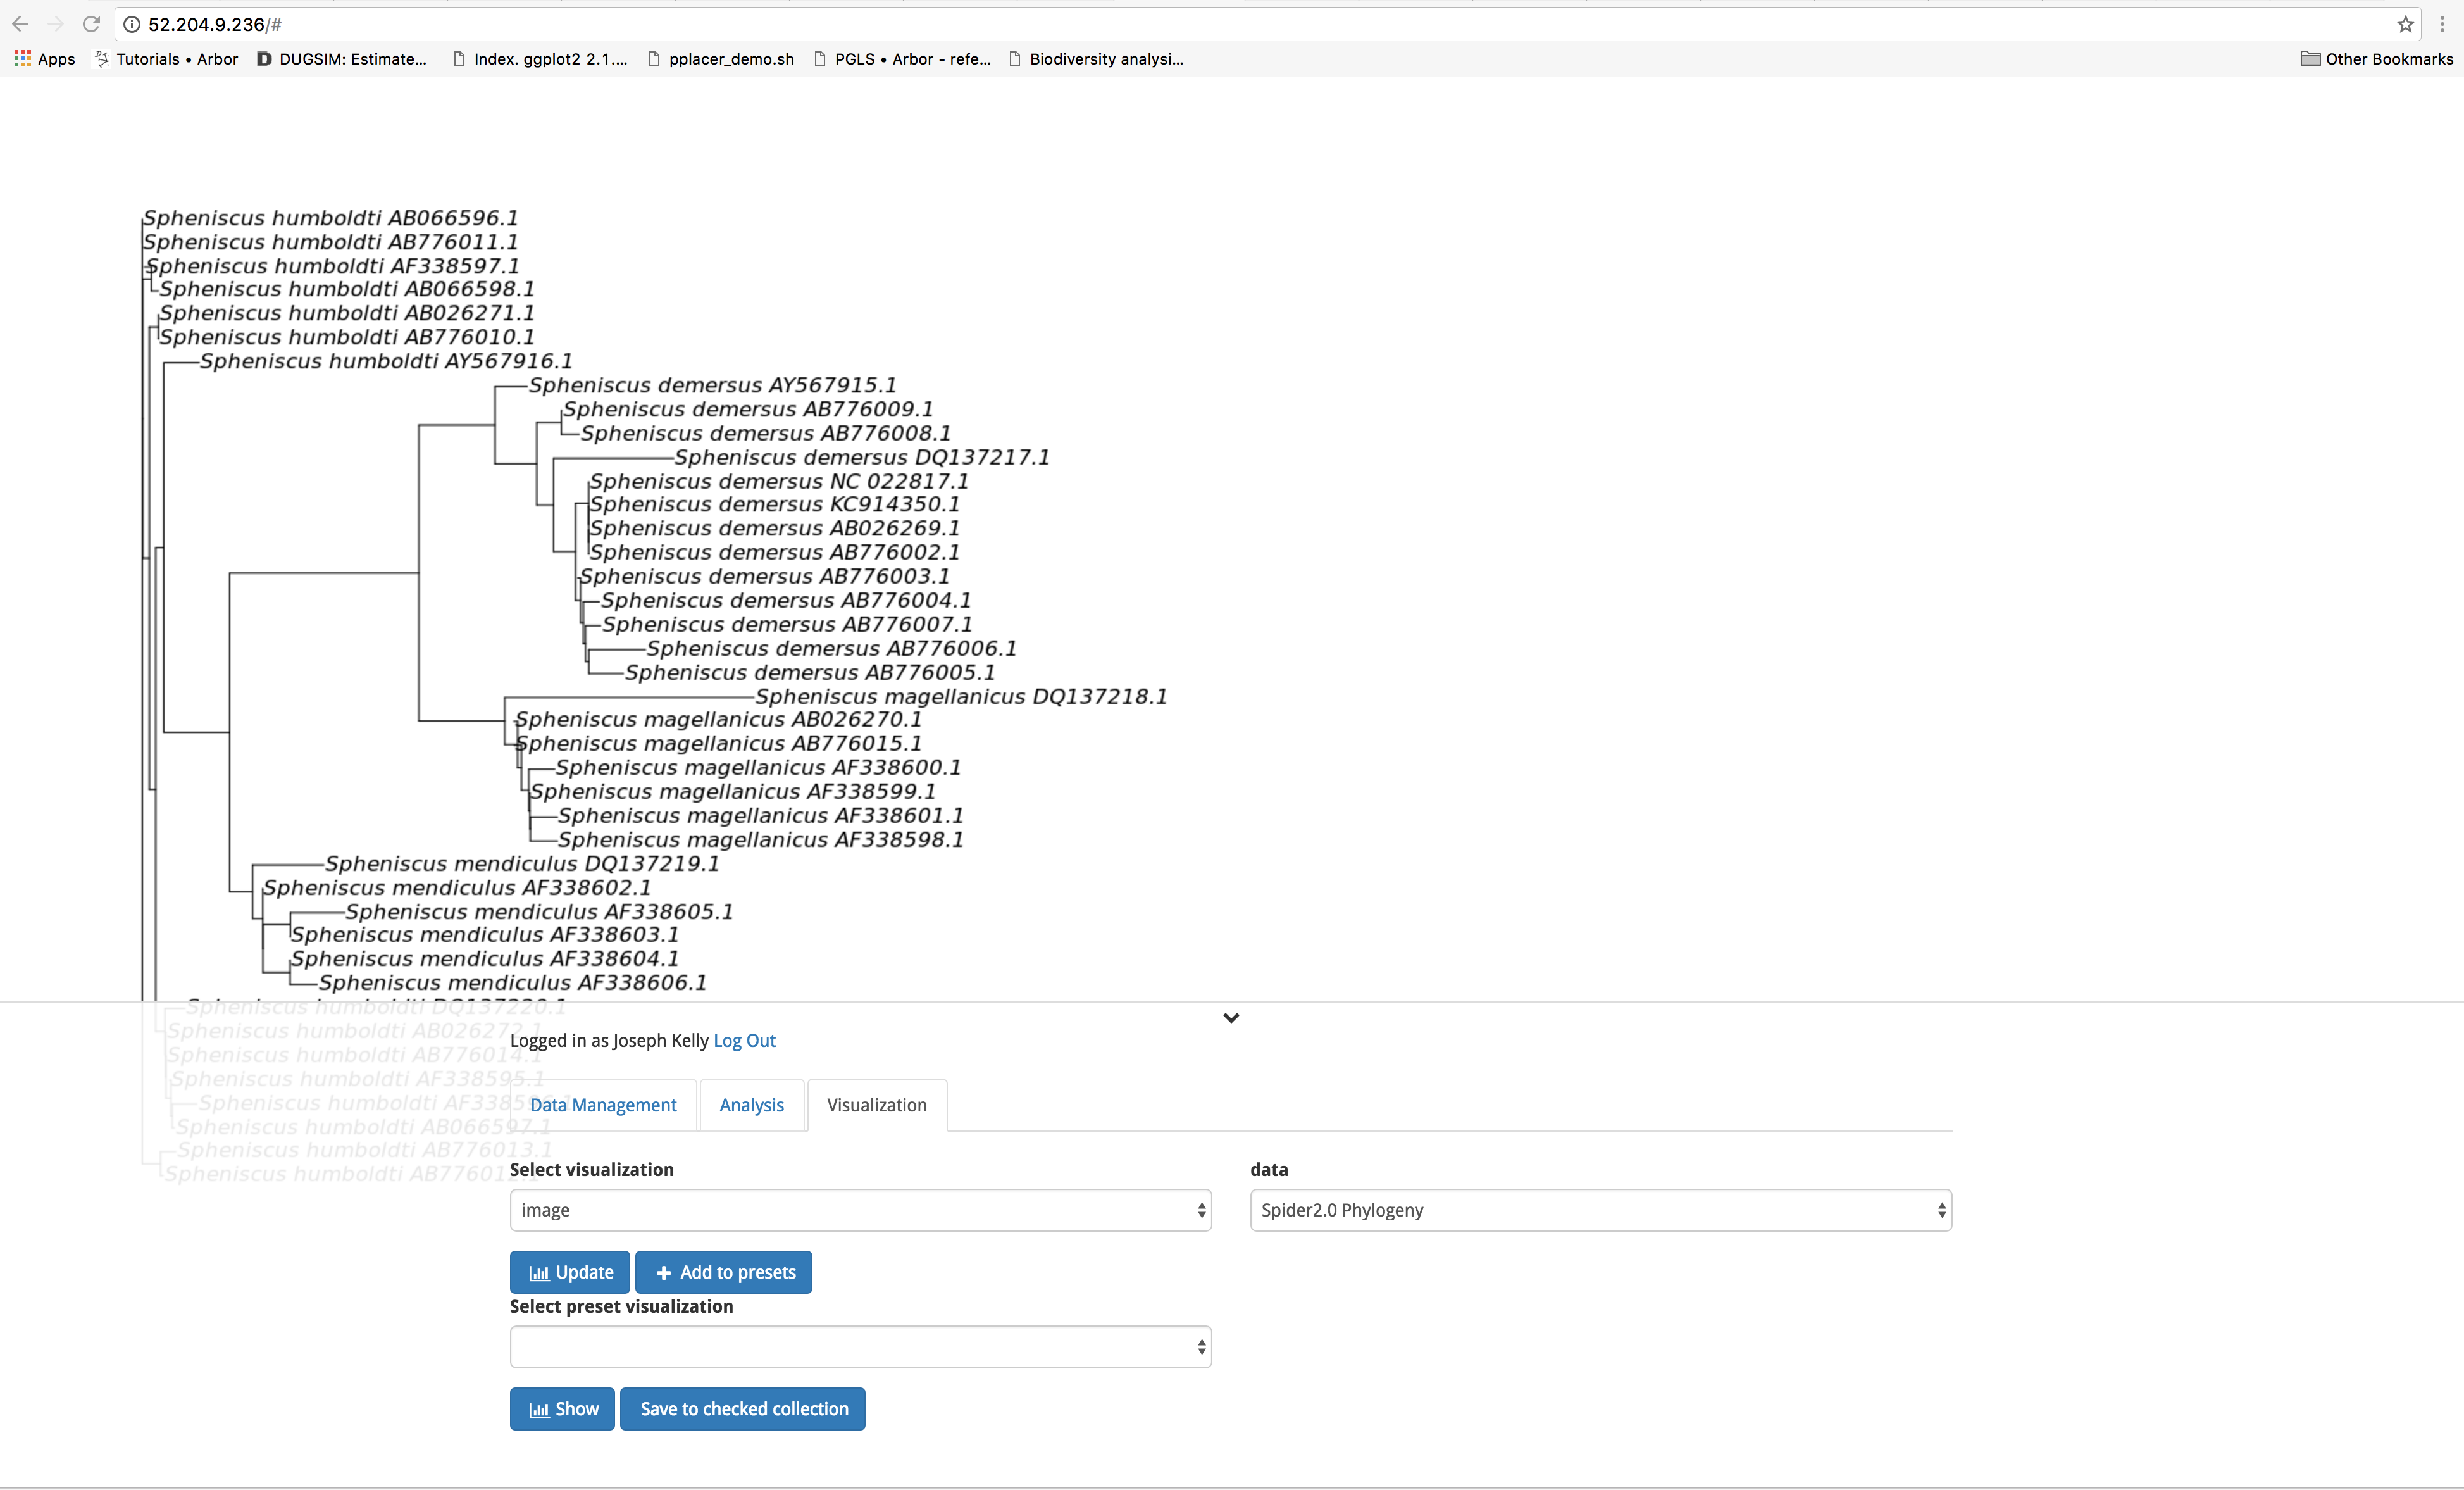
Now let’s have a look at the outputs of our analysis. Outputs can be viewed under the ‘Visualization’ tab. To access a given output, select the class of output from the dropdown menu under select visualization. Next, pull up the output you wish to view from the dropdown menu under data. Finally, click on the blue ‘Update’ button. You can click the downward pointing chevron to the right of your login information to collapse the interface to get an unobstructed view of your output. Clicking on this arrow a second time returns the interface to the screen. Let’s have a look at the Phylogeny produced by the Spider2.0 workflow.
To download the output, return to the ‘Data Management’ tab and scroll to the bottom of the screen. Under Save or download data you are able to select your output from the drop down menu. Next, select the desired file format (.png or .jpeg for images such as our phylogeny), and click the blue ‘Download’ button.

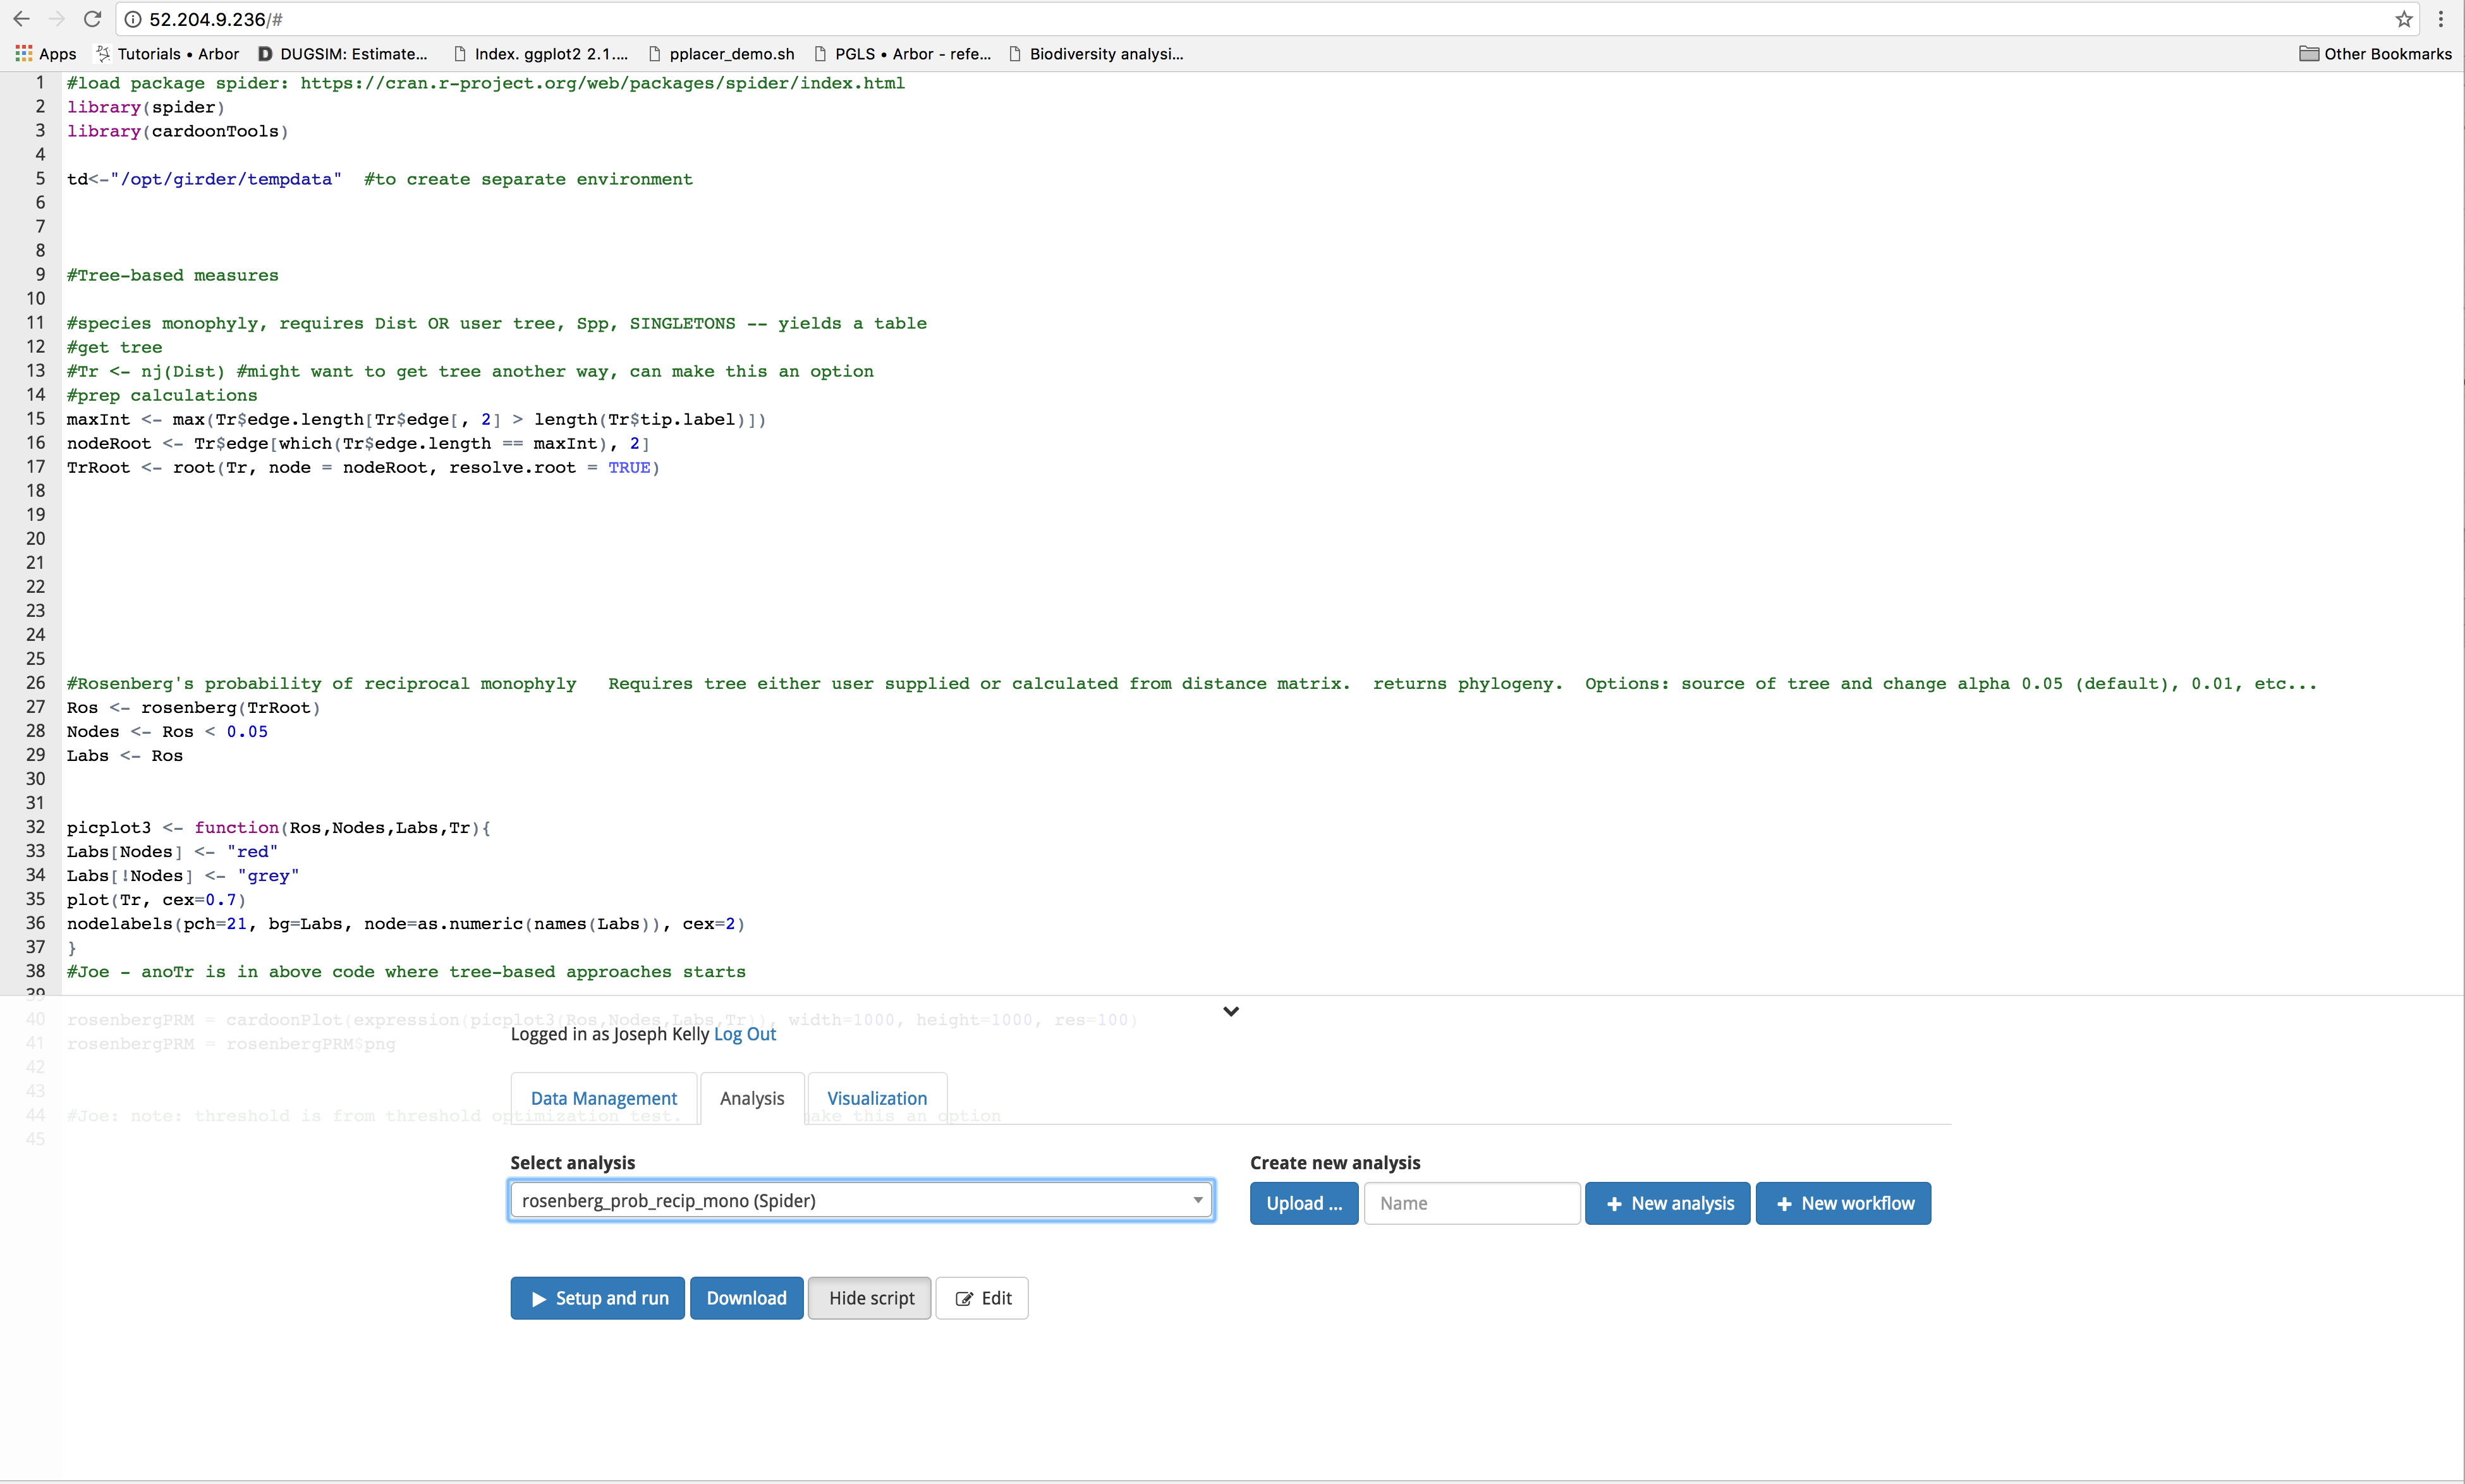
Examine the R scripts for each module
Arbor workflows are constructed using modules that can be assembled as needed to fit the specific needs of your analysis. To view the script, click the ‘Show script button’ under the analysis tab. You can also choose to download the module as a .json file by clicking on the blue ‘Download’ button.