Use PGLS to test for a correlation between two continuous variables
In this exercise, we will learn how to use PGLS to test for a correlation between two continuous variables. We will use the Arbor function “PGLS,” found in the phylogeny package.
Imagine that you have a phylogenetic tree with information on two continuous character for some or all of the tips. You want to test whether or not there is an evolutionary correlation between the two traits. PGLS is the way to do this.
Loading example data
For this example, we will use anolis again. Obtain the anolis example data files, phelsuma.phy and phelsuma.csv, from Arbor datasets. Save those files somewhere on your computer.
Now open the Arbor web app. Drag and drop the two anolis data files on the blue “Browse or drop files” box to load them into your browser.
Selecting the collections that you need
For this example, everything required is in the “phylogeny” collection - so click on that eyeball and you will be able to access the functions that you need.
At this point, you should have the two anolis datafiles stored in Arbor and the “phylogeny” collection available.
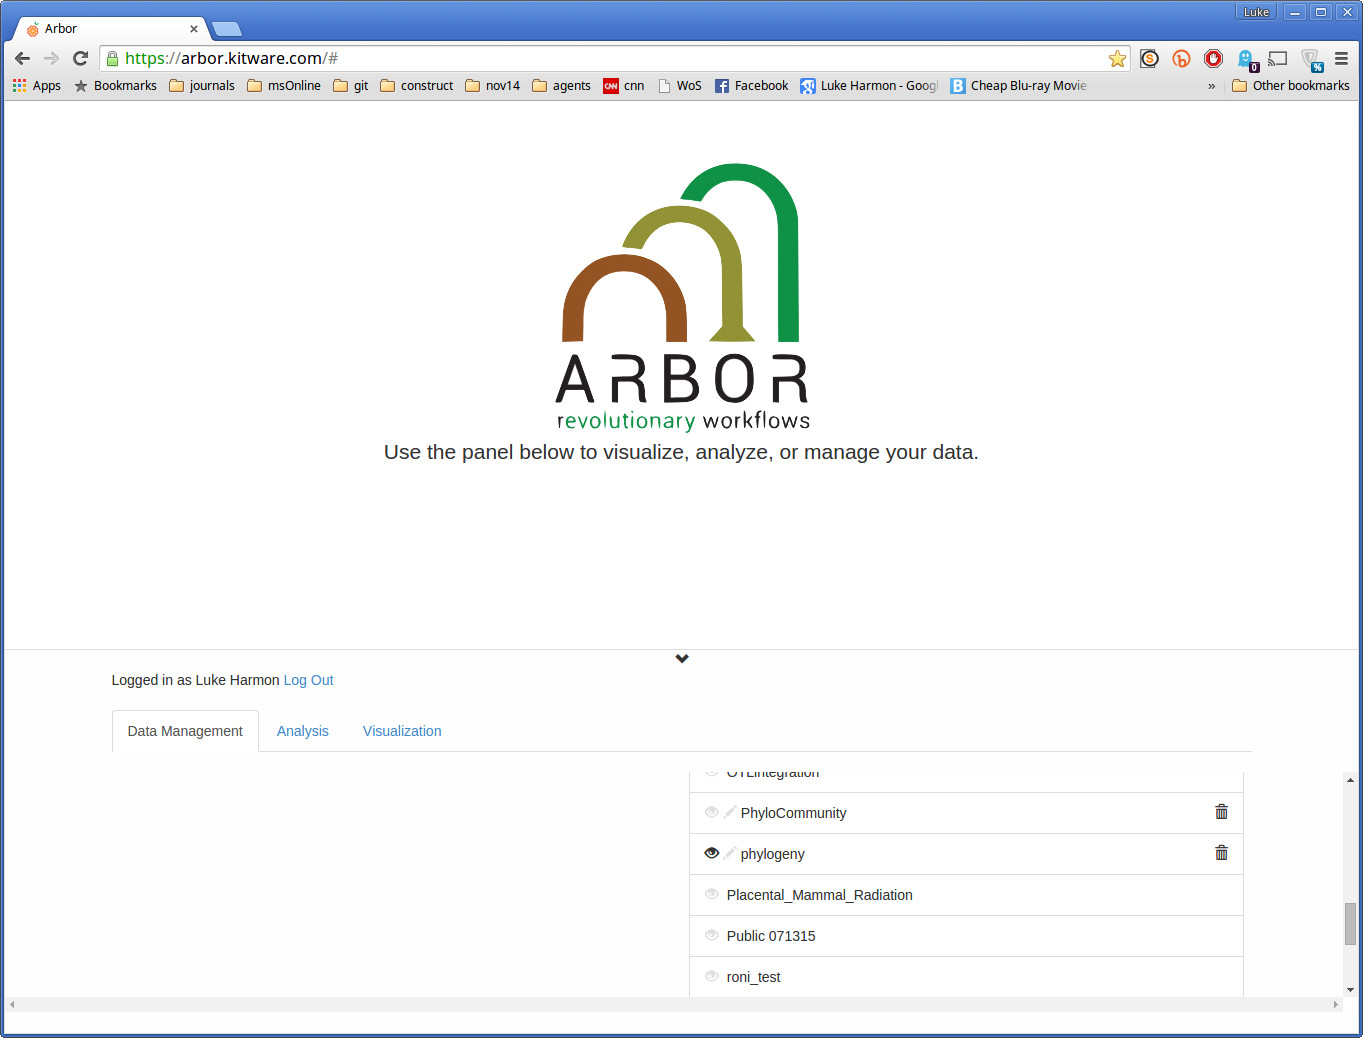
In this screenshot I am logged in but that is not necessary for this analysis.
Run the PGLS function
Find the PGLS function in the “phylogeny” collection. Select that function now. You can view the source code for it by choosing “show script” (it is in R).
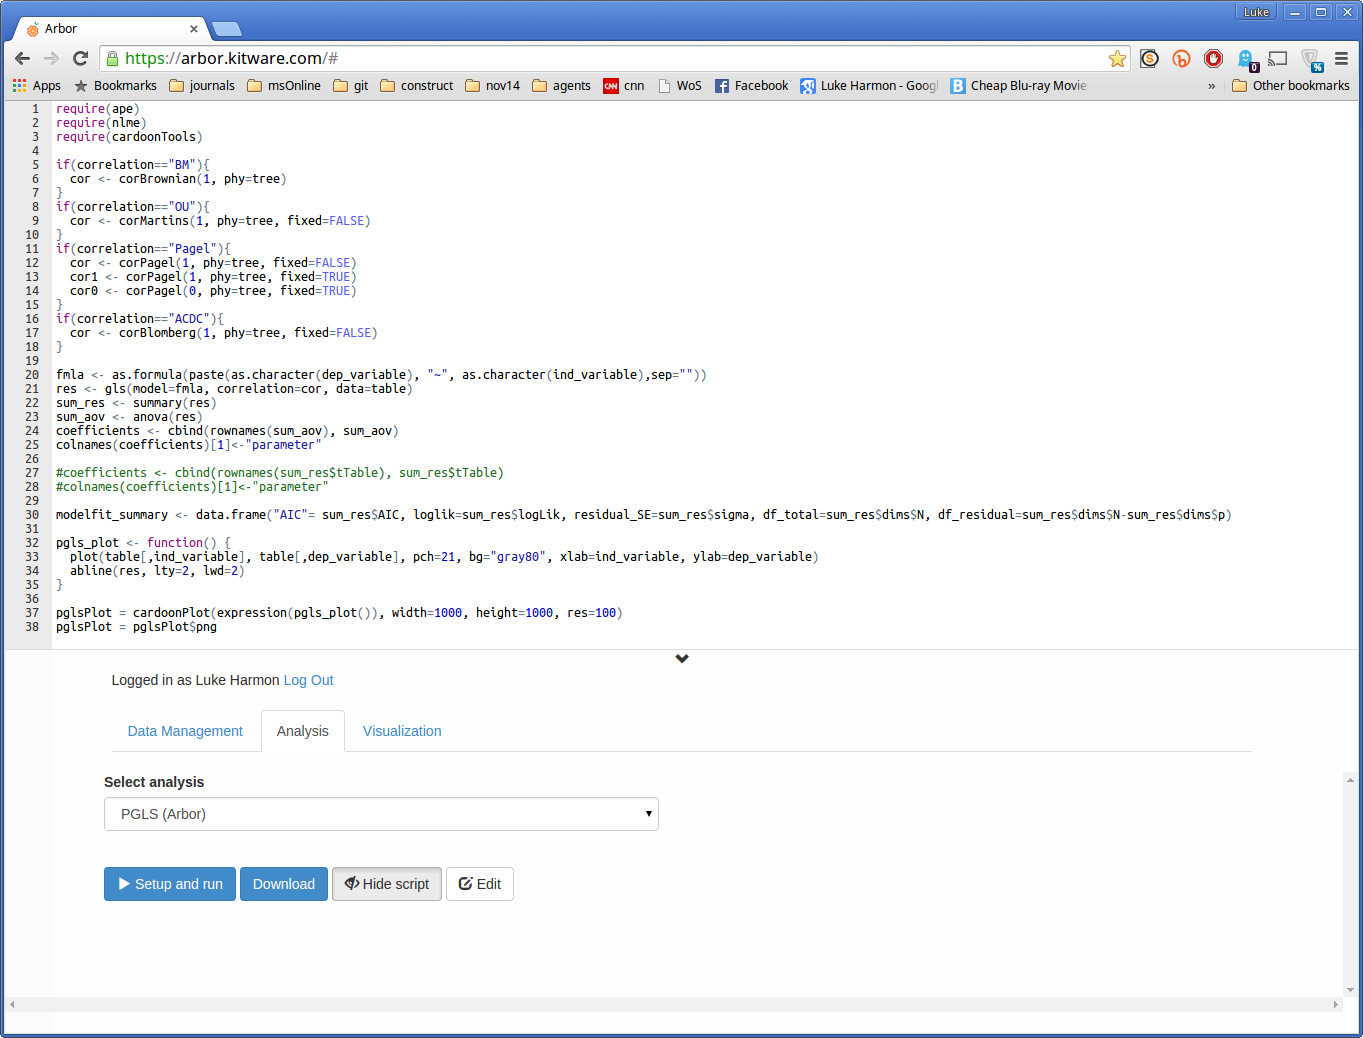
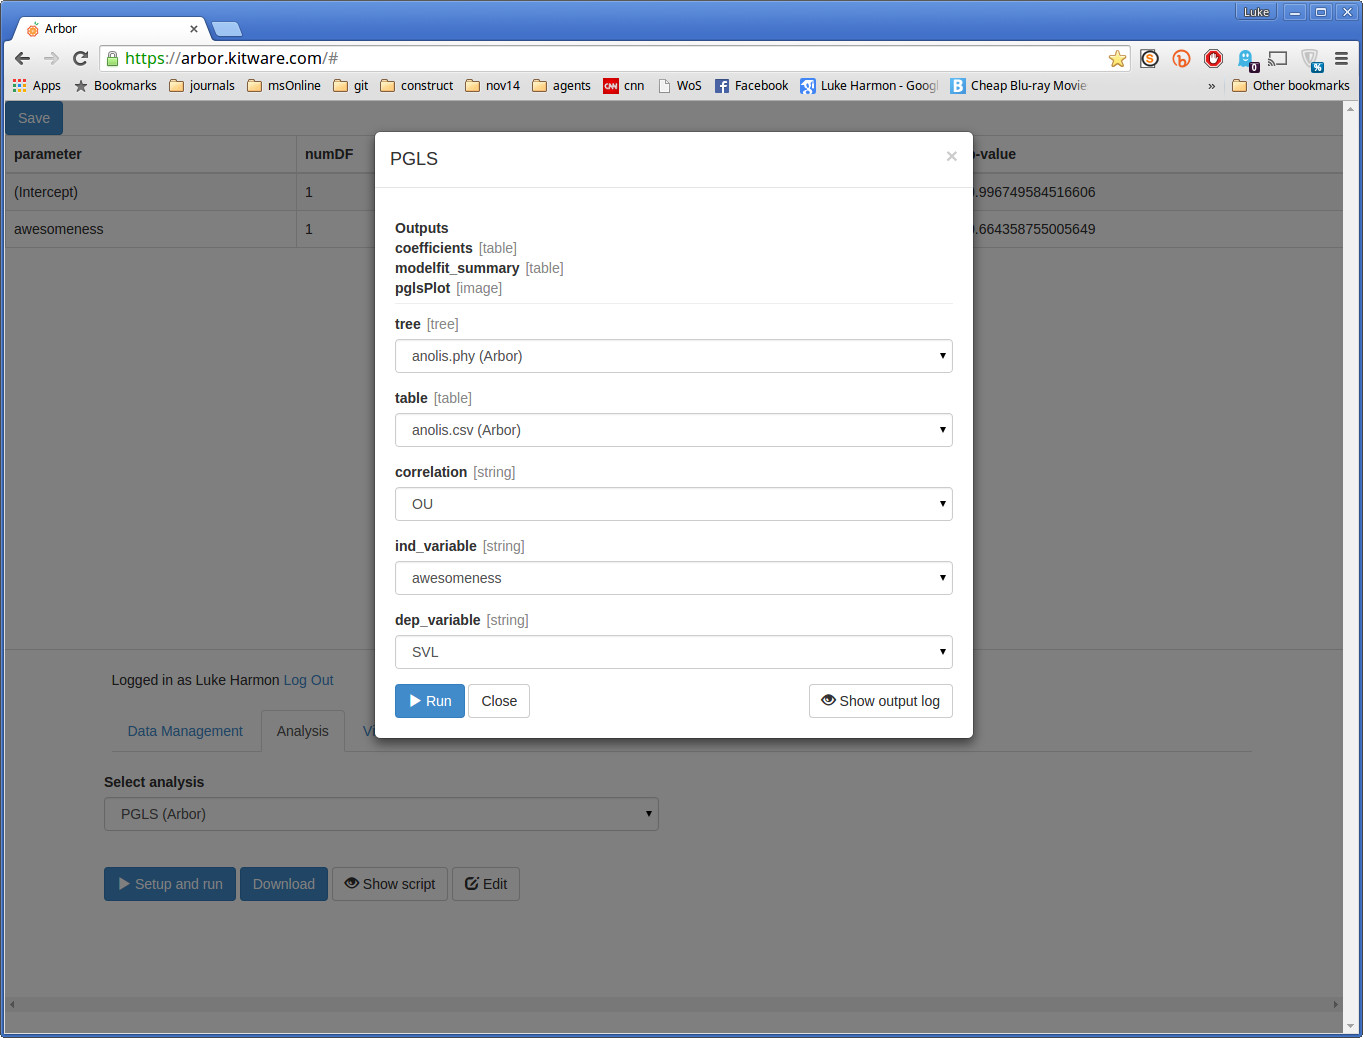
We could use this function in a workflow, as we did in other Arbor tutorials. But for this tutorial let’s just run the function. To do that, click on the button that says “Setup and run.” In the resulting pop-up menu select the following options:
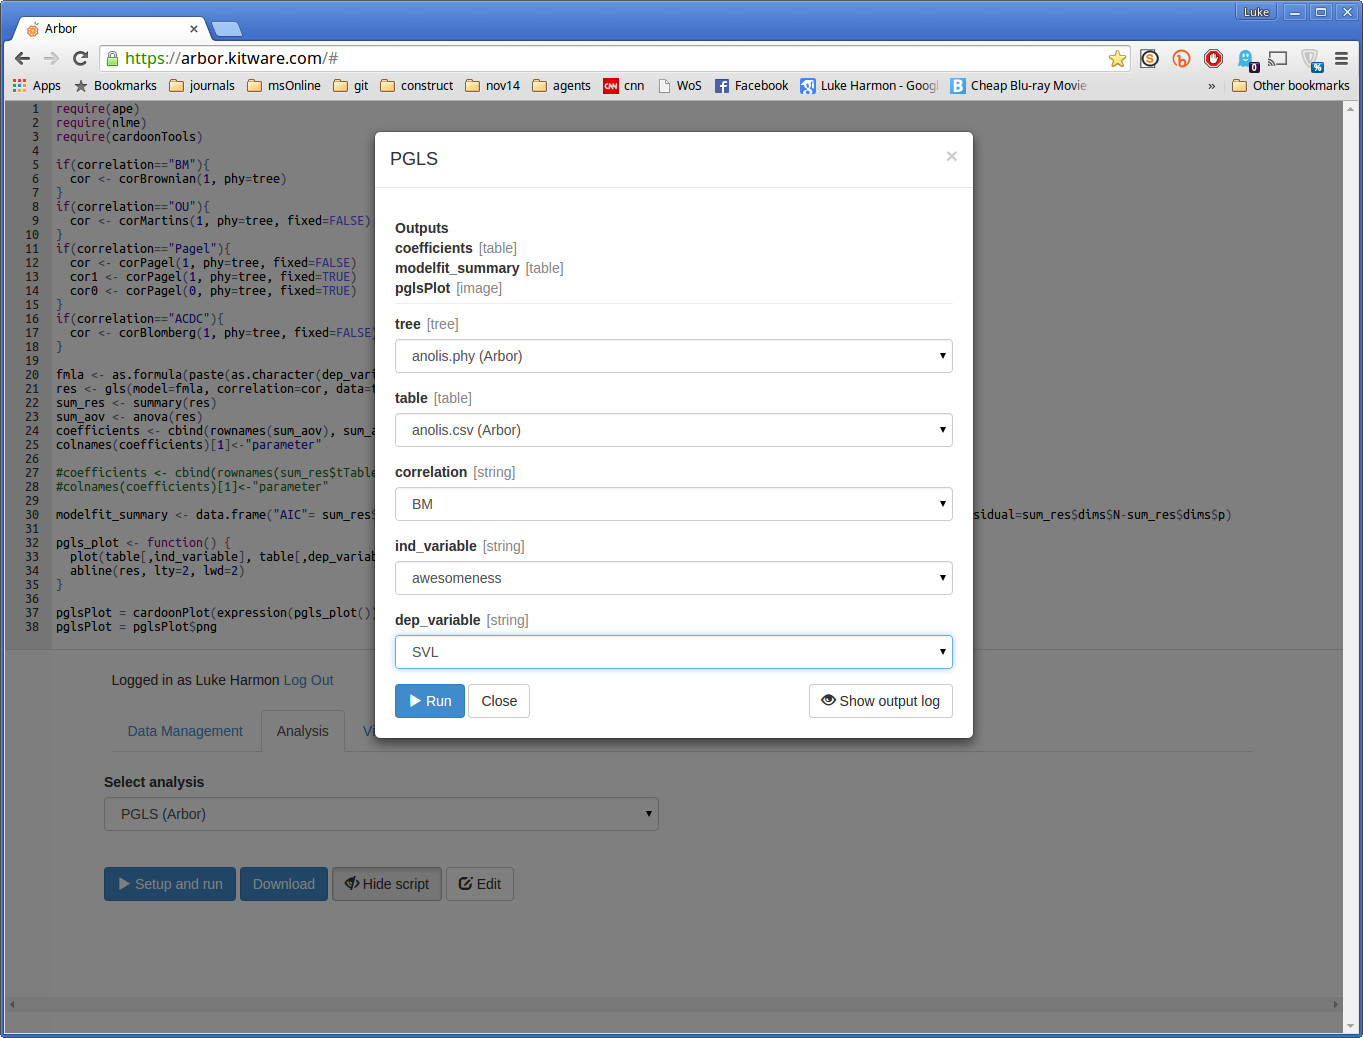
We will be fitting the model SVL ~ awesomeness, so that SVL is the dependent and awesomeness the independent variable. “BM” means that we will fit a model that assumes that the residuals are distributed as expected under a Brownian motion model of evolution along the branches of the tree.
Run your analysis
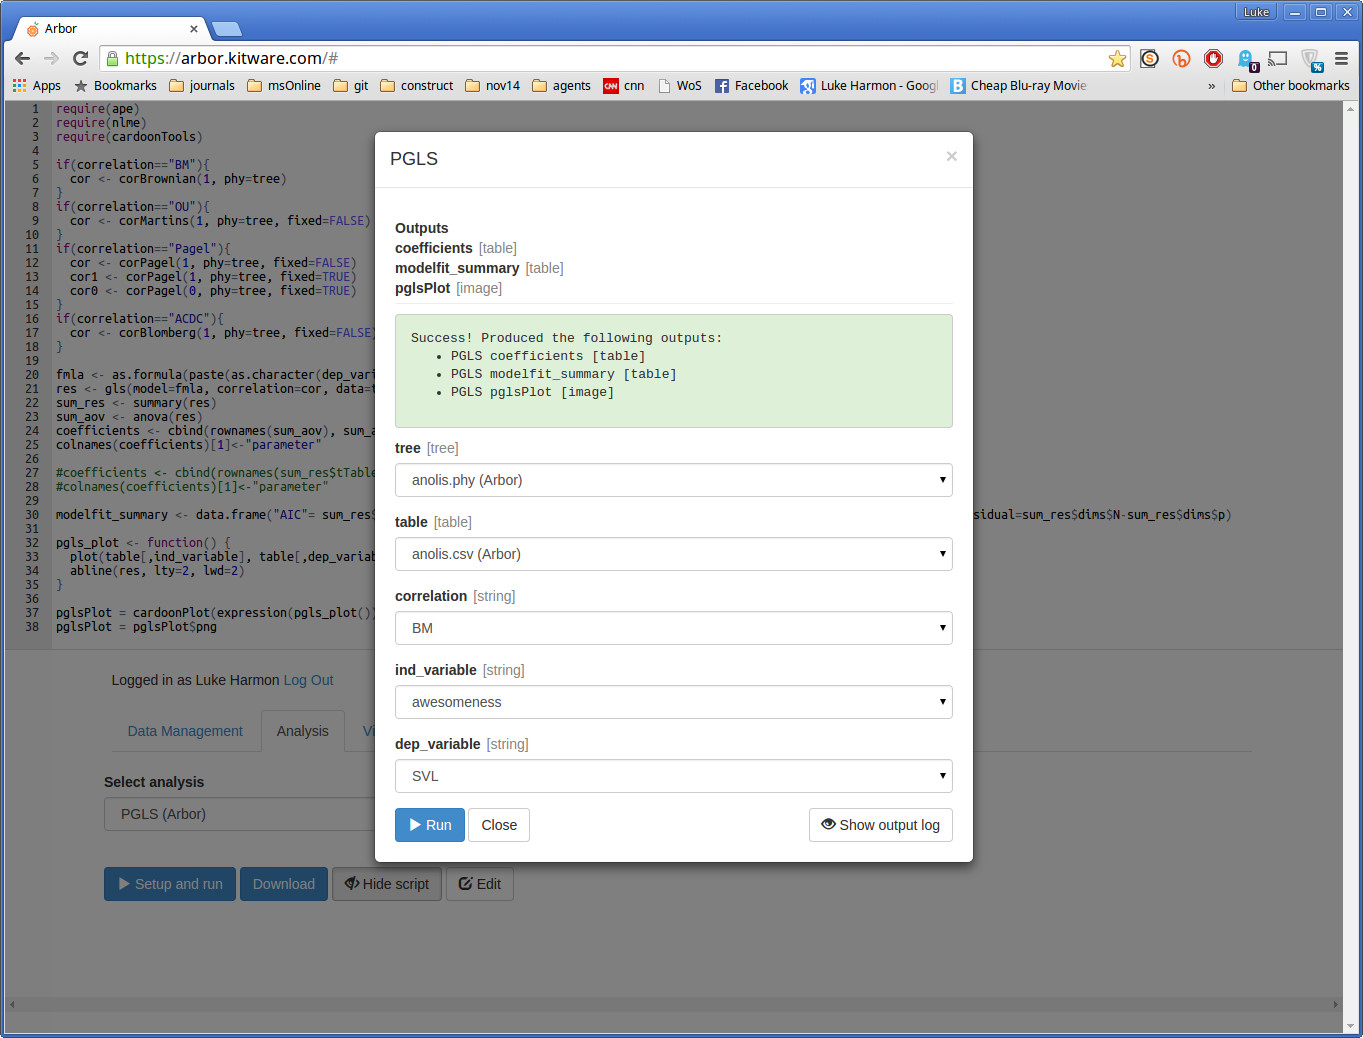
Click “> Run” to run the function. Select these options. If your analysis worked, you should see the following message:
 .
.
See your results
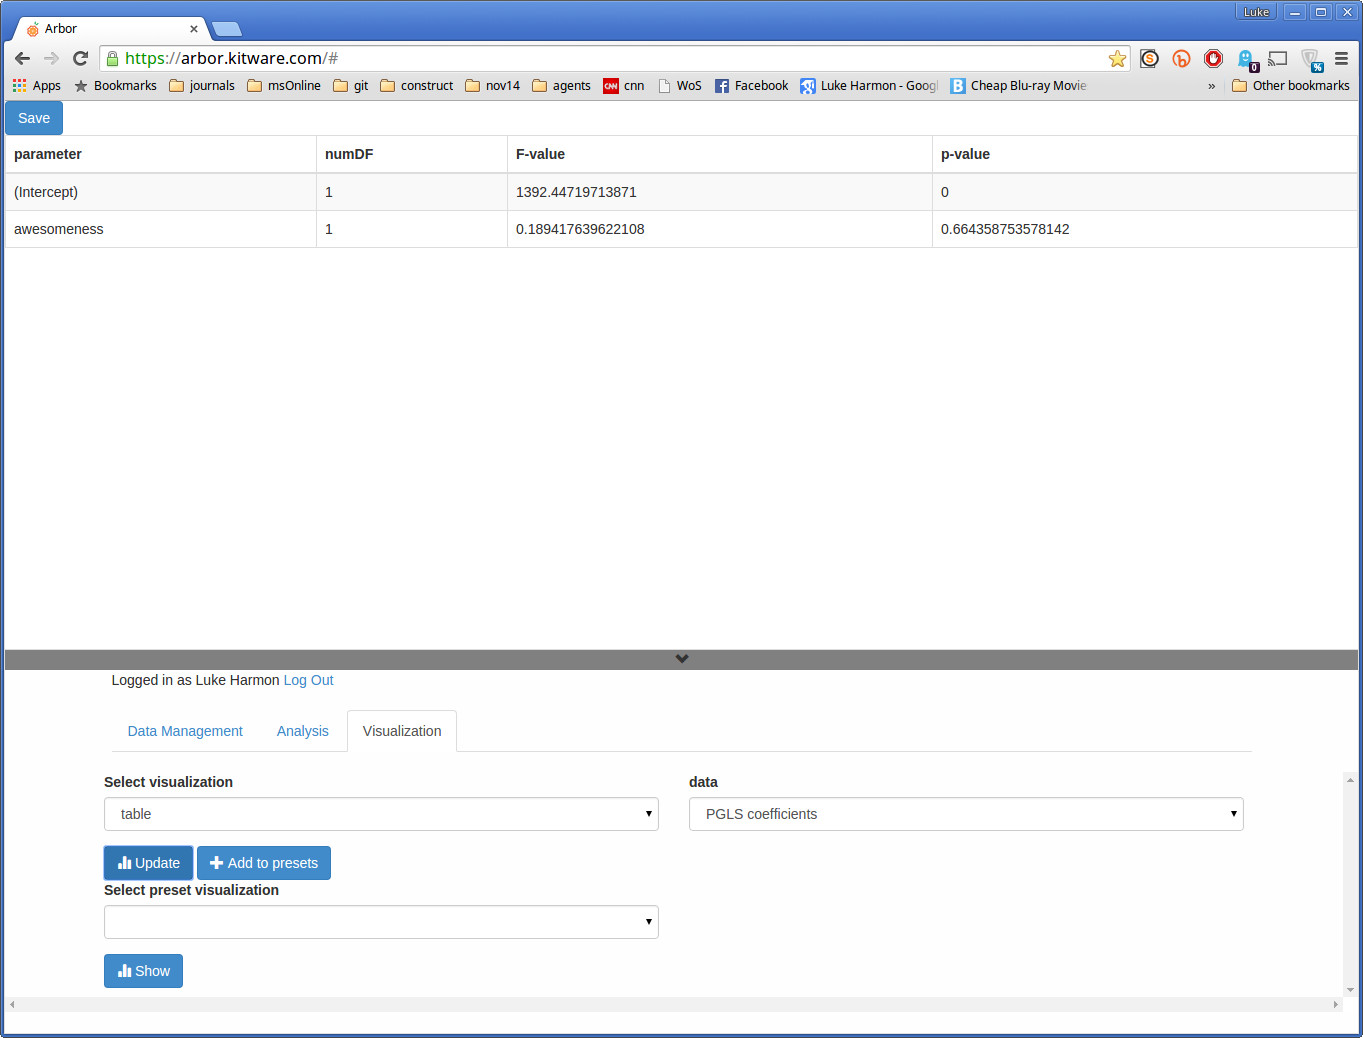
Now move over to the “visualization” tab to see your results. The PGLS function creates three outputs: one table showing model coefficients like slopes and intercepts; one table showing a summary of model fit and parameter significance; and a plot.
To see the table results, choose “table” and choose one of the outputs, either “PGLS coefficients” or “PGLS modelfit_summary”. Update shows you the table. For example, the coefficients look like this:
 .
.
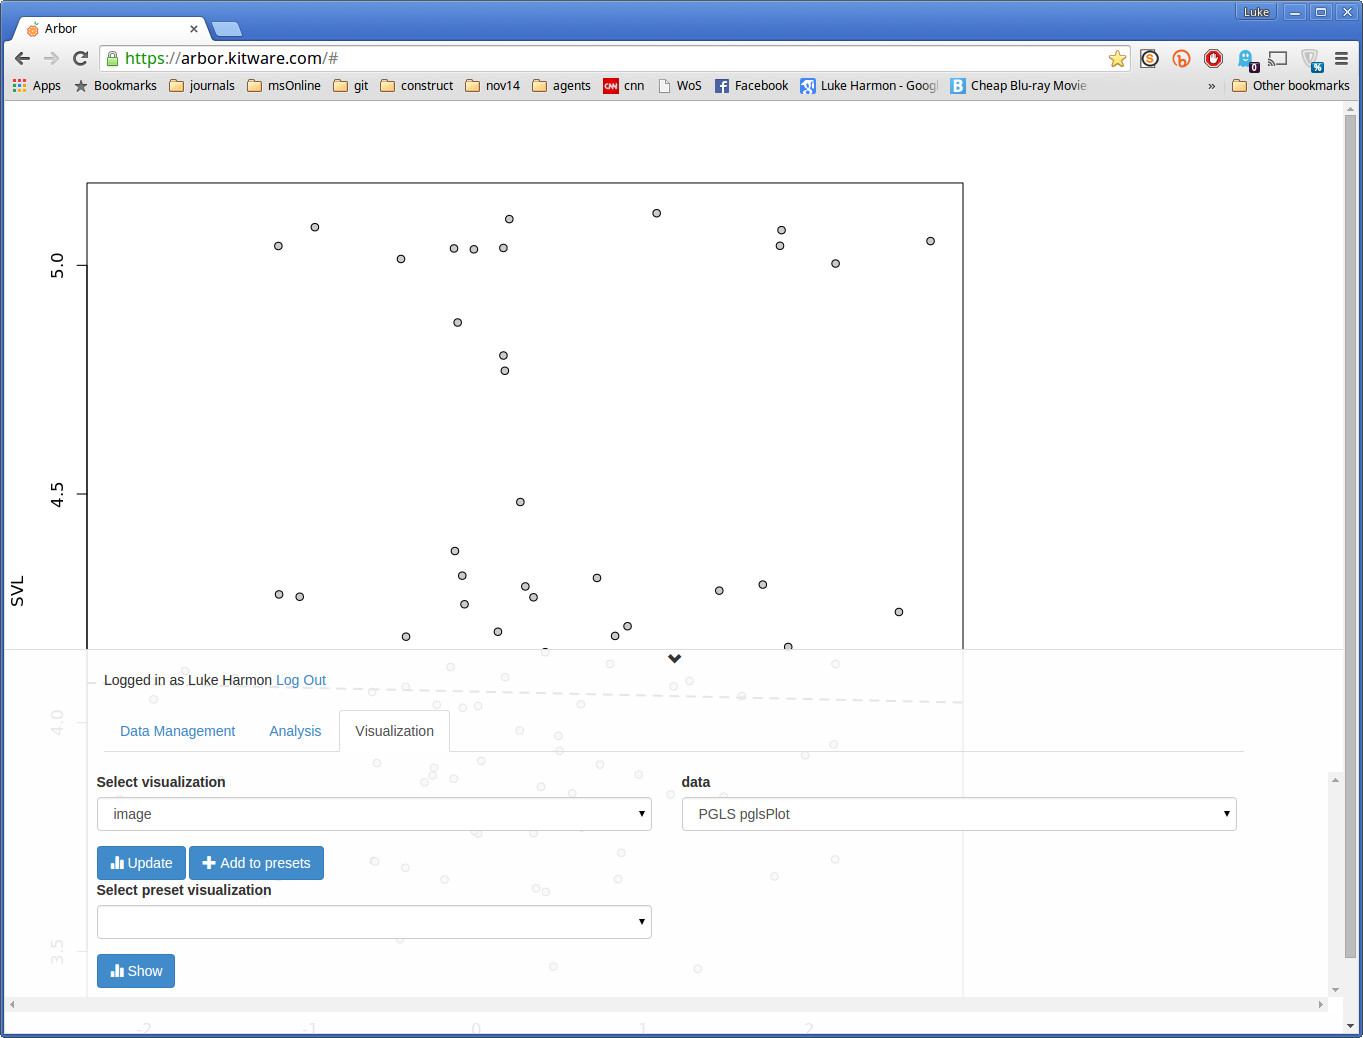
To see the plot, select “image” under “Select visualization”, and choose your plot under “data” (it should be called PGLS pglsPlot). Click “update” to see this result:
Try another model
If you want to use a different option for PGLS, you can choose that in the setup and run window. For example, we can try OU like this:
You will notice that the coefficients are slightly different, though the main conclusion is unchanged.
