Use R package ‘picante’ to explore and analyze community data.
This tutorial will guide the user through Steven Kembel’s biodiversity workflow developed for the R package ‘picante’. Picante allows users to analyze community ecology data sets in a multivariate and phylogenetic context.
Documentation for picante can be found at https://cran.r-project.org/web/packages/picante/index.html, and the original workflow can be found at http://kembellab.ca/r-workshop/biodivR/SK_Biodiversity_R.html.
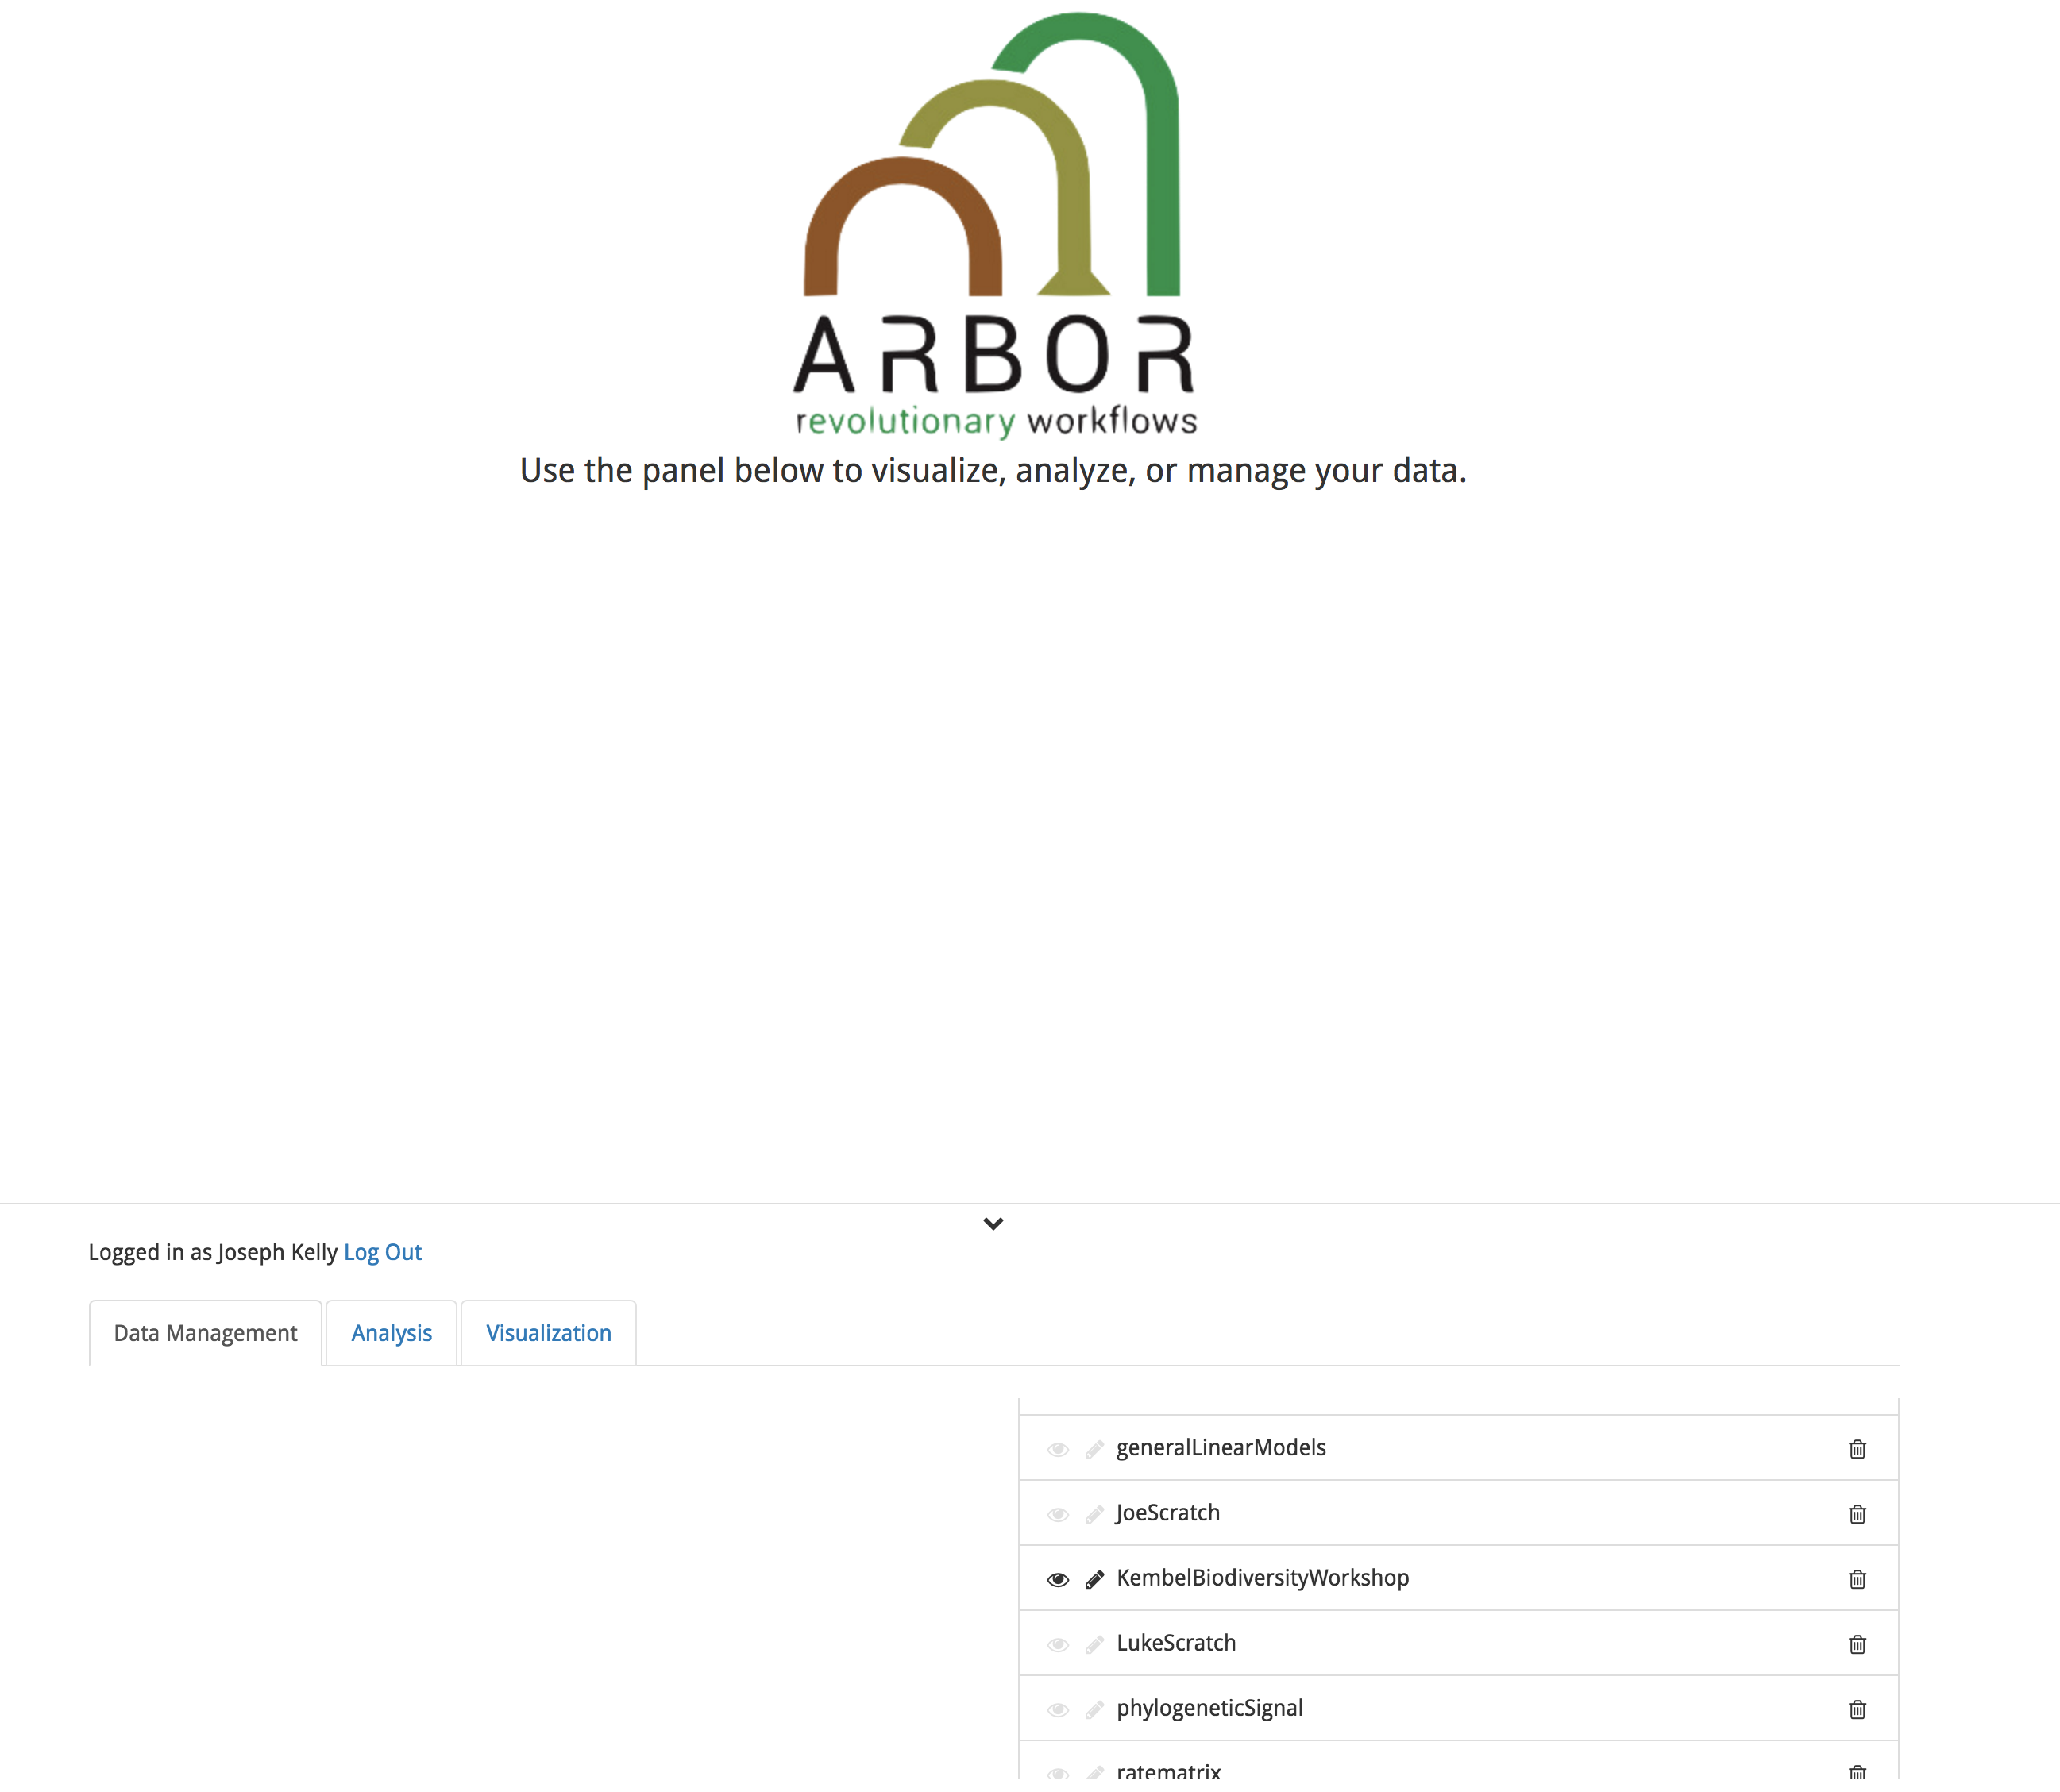
The Arbor instance we will be using for this tutorial can be located at http://52.204.9.236/. To prepare for the tutorial, sign in using your username and password and highlight the eyeball icon next to the KembelBiodiversityWorkshop directory.
Loading example data
This tutorial will use files containing species traits, species abundances, a species phylogeny, and community metadata. These files are saved in the Arbor instance, and are called:
- species.traits.csv (KembelBiodiversityWorkshop)
- grassland.community.csv (KembelBiodiversityWorkshop)
- plot.metadata.csv (KembelBiodiversityWorkshop)
- grassland.phylogeny.newick (KembelBiodiversityWorkshop)
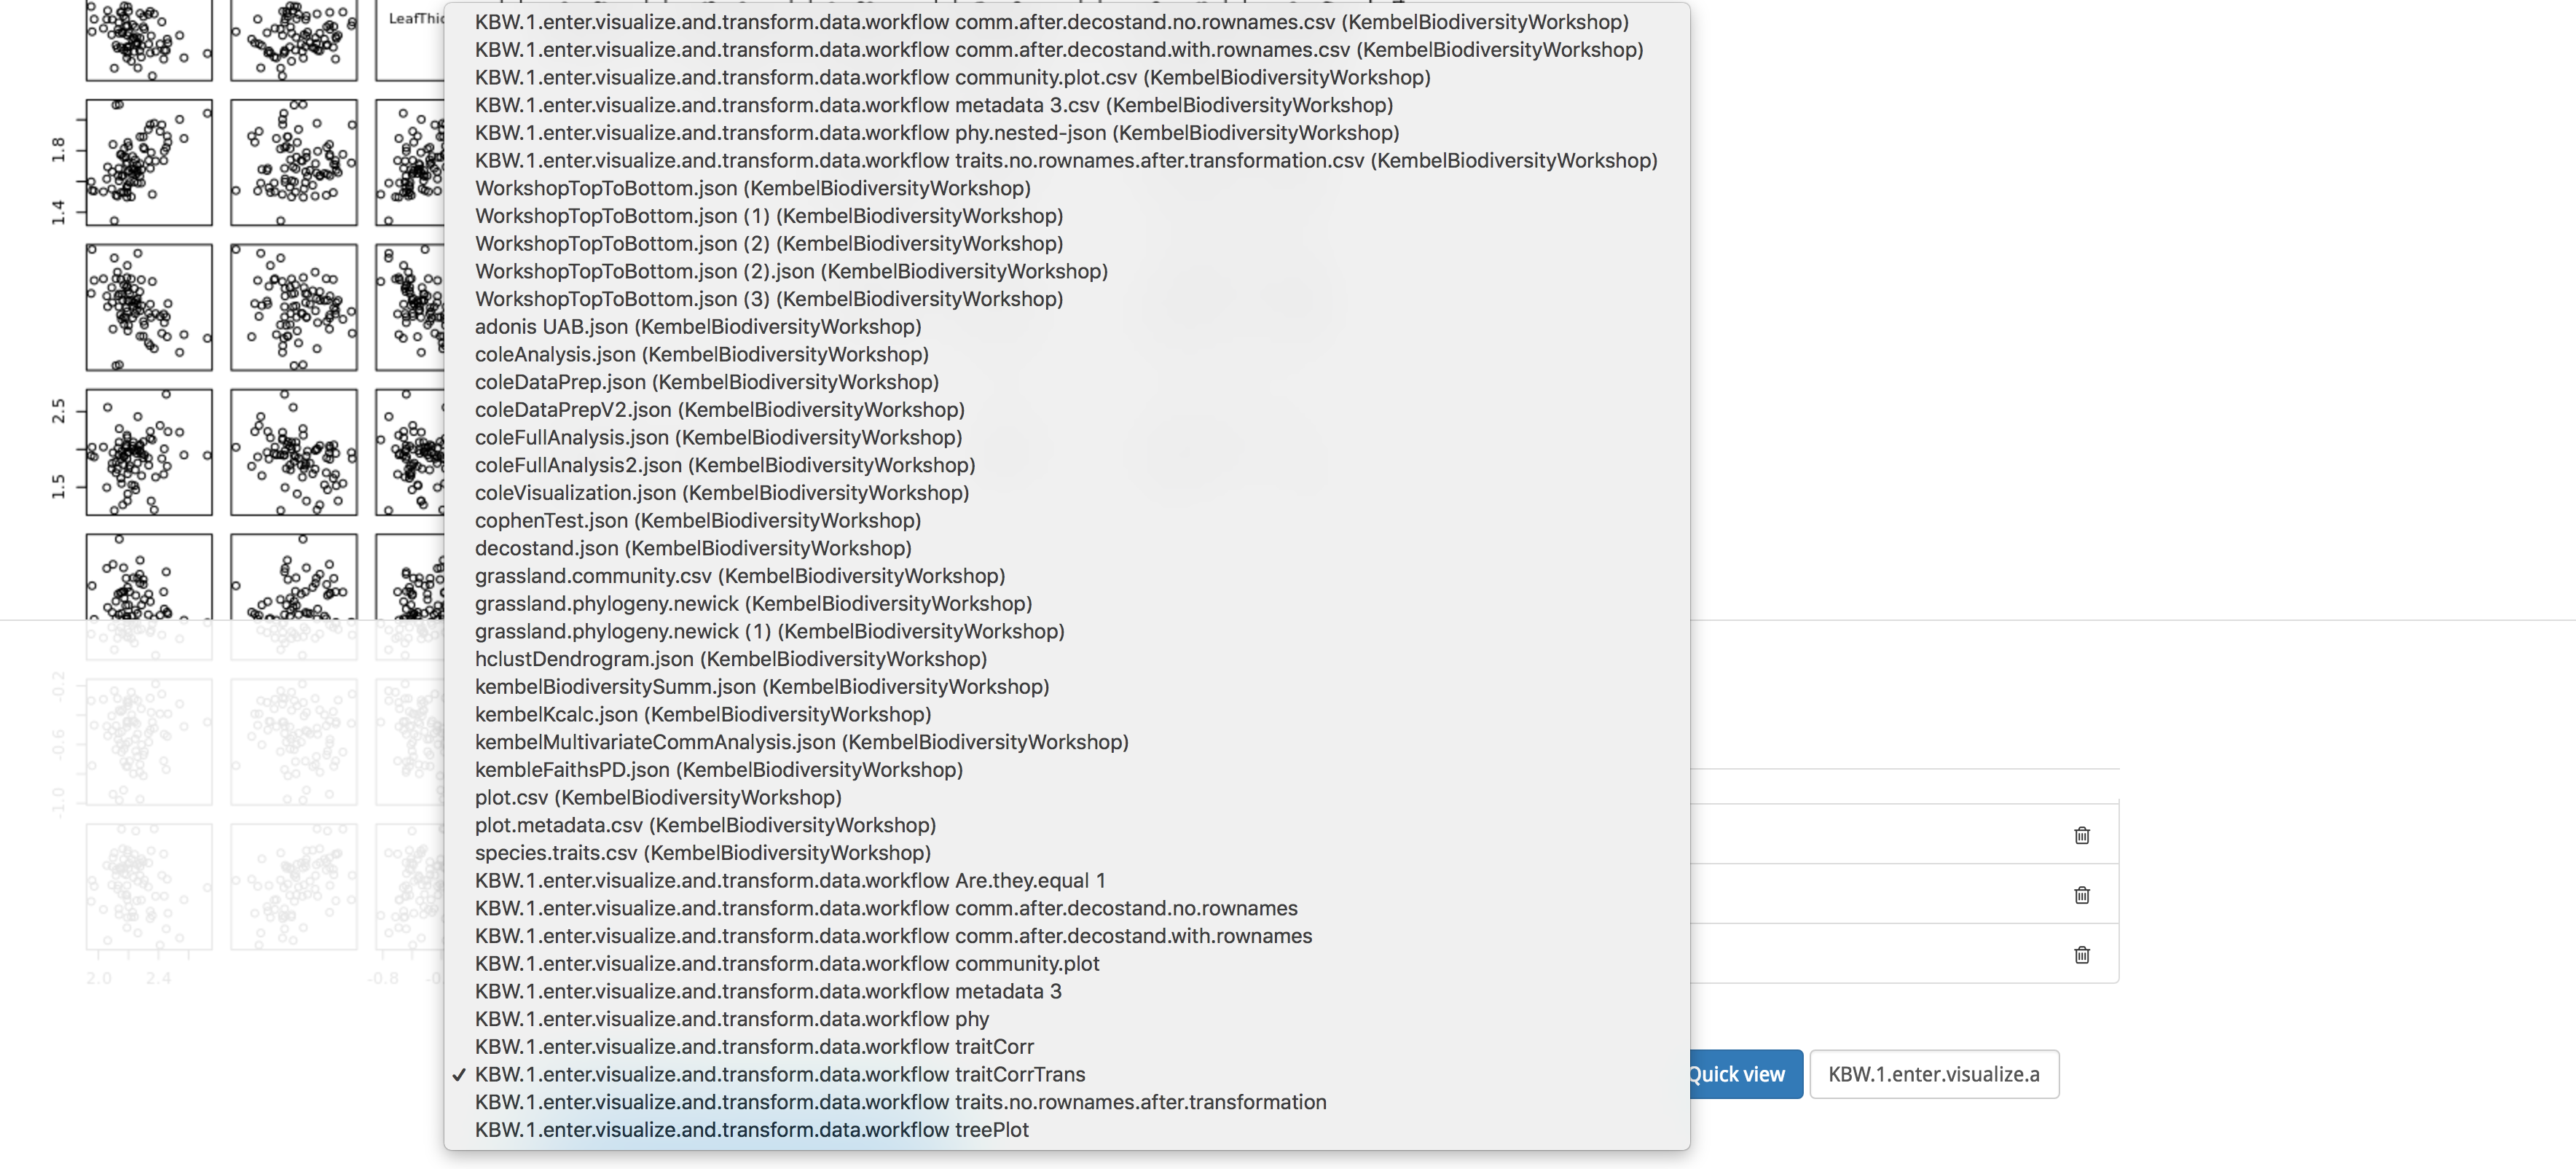
If you wish to download and view a file, select it from the dropdown list at the bottom of the Arbor homepage and click the download button.

Run the data visualization and transformation workflow
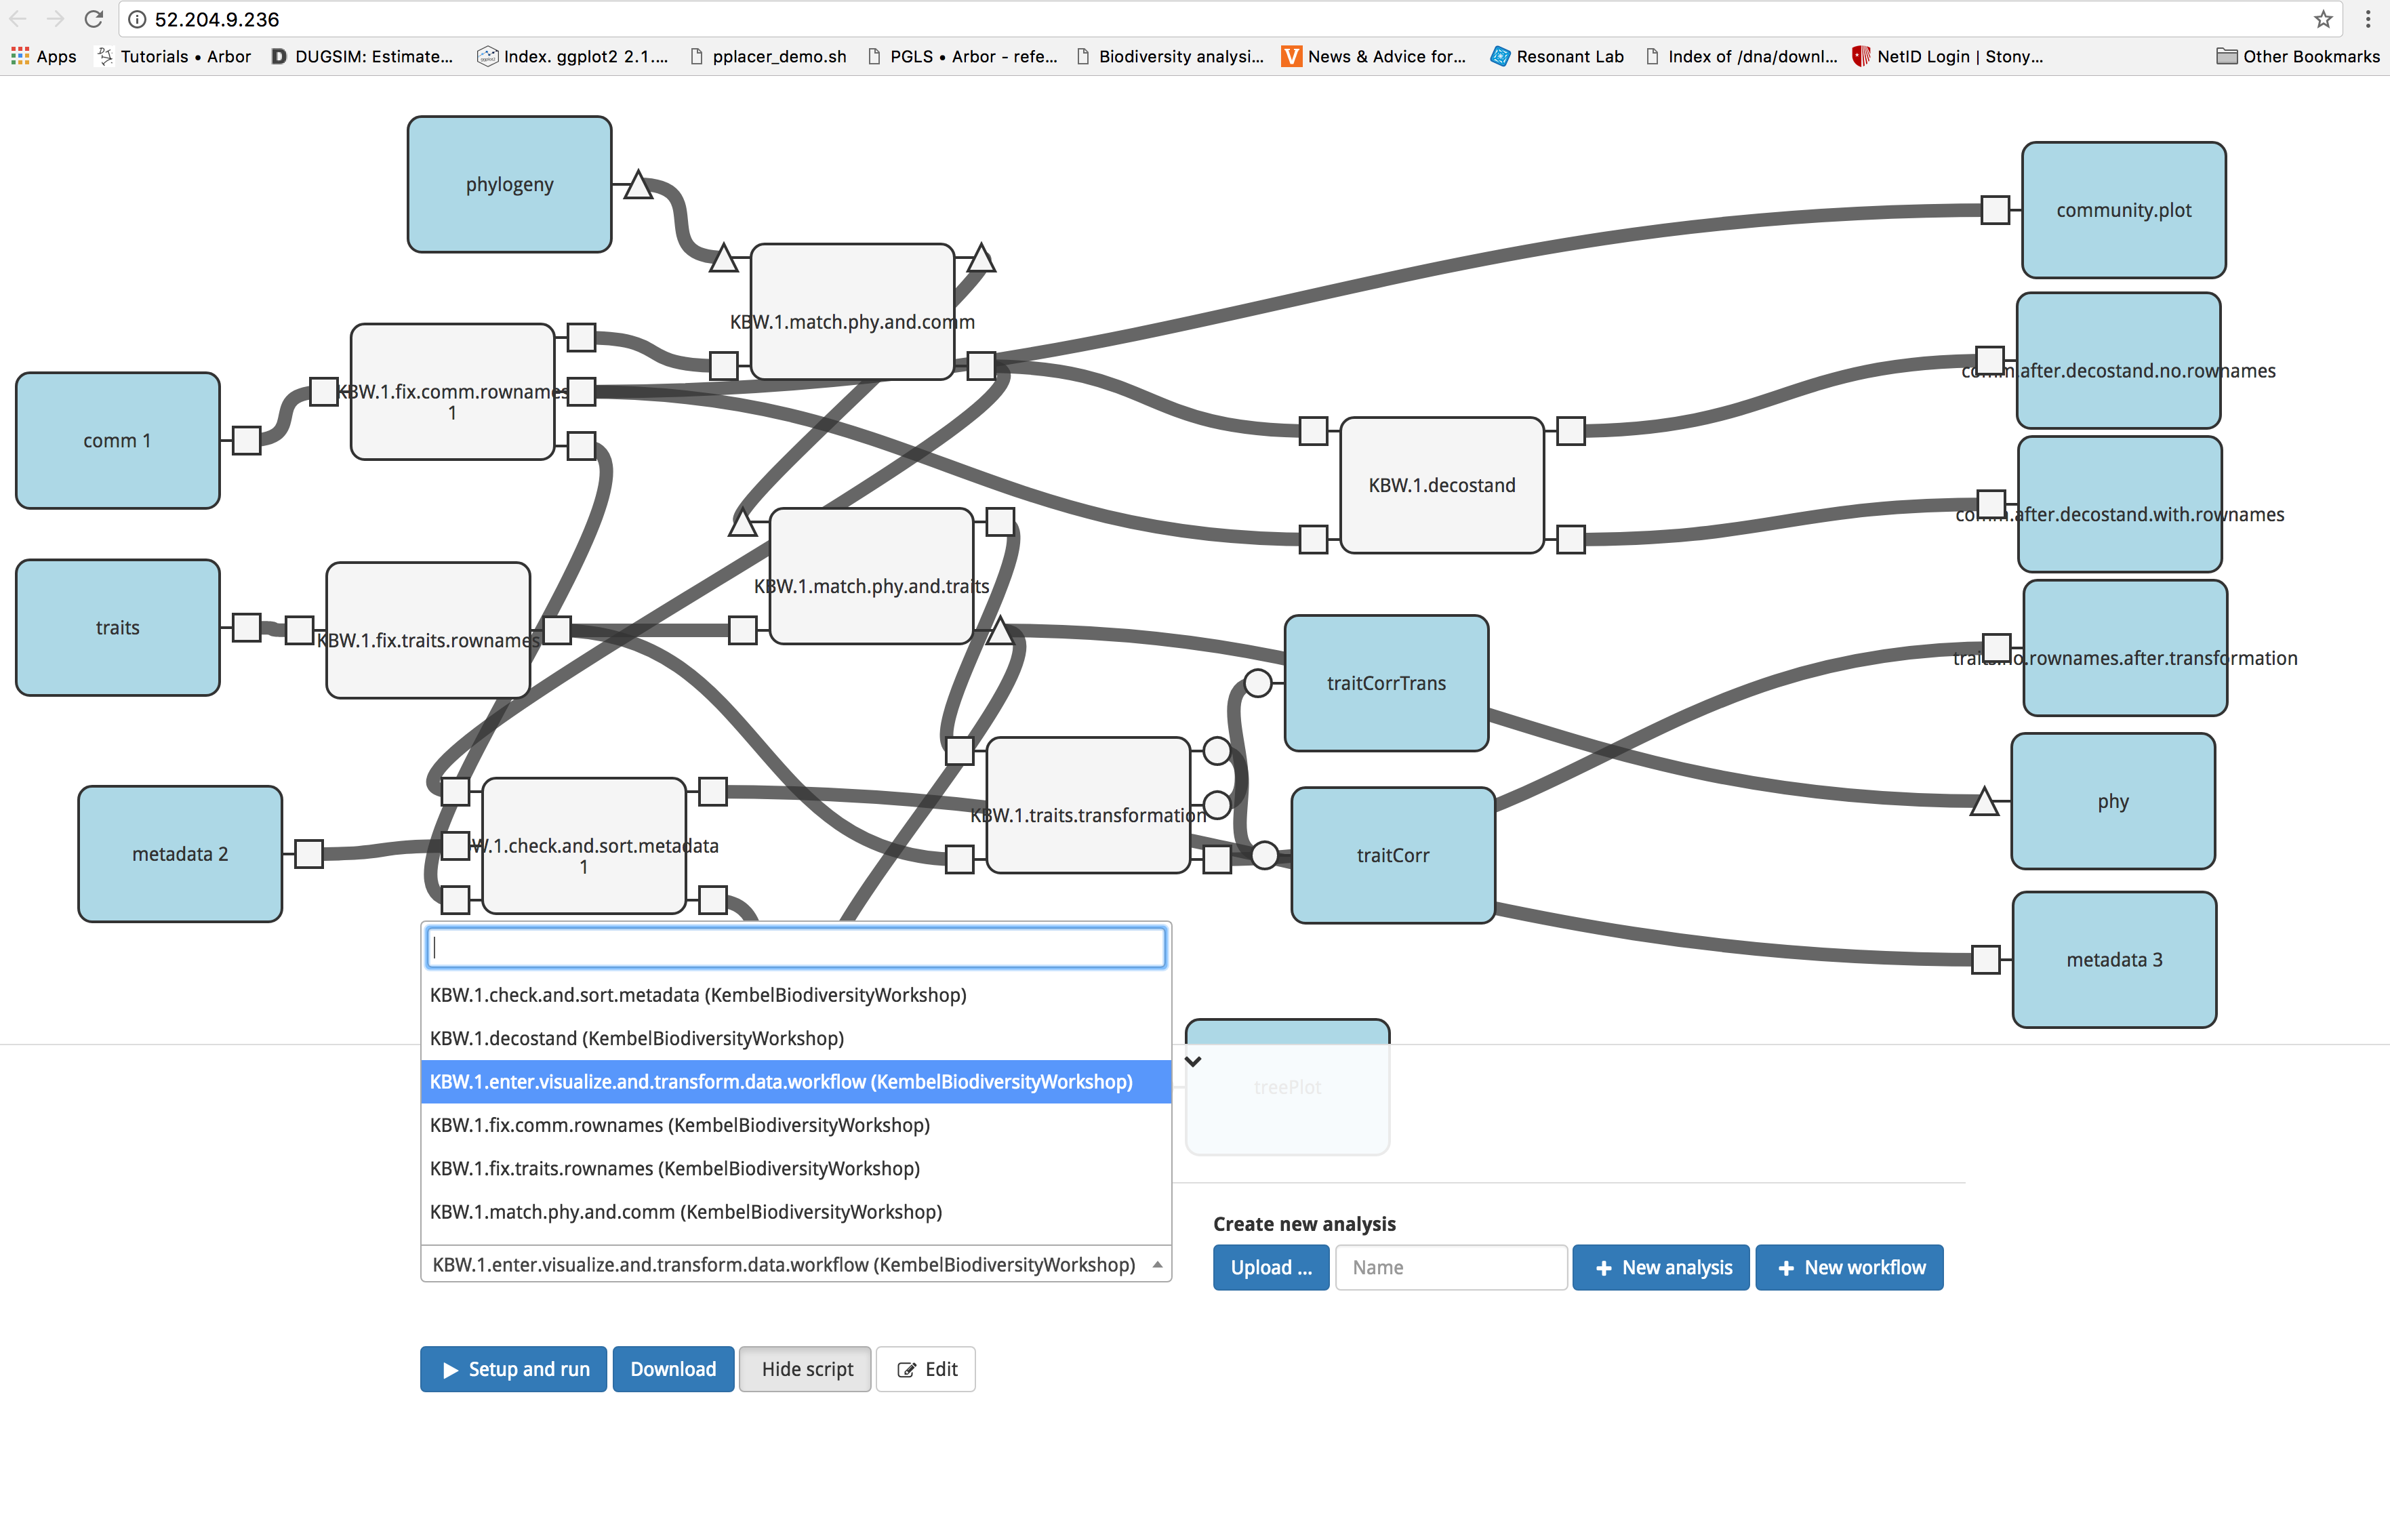
Before we run any analysis on the data, we are first going to transform and standardize it. To accomplish this, we will use the ‘KBW.1.enter.visualize.and.transform.data.workflow (KembelBiodiversityWorkshop)’ workflow. Begin by clicking on the ‘Analysis’ tab, then select ‘KBW.1.enter.visualize.and.transform.data.workflow (KembelBiodiversityWorkshop)’ from the dropdown menu.
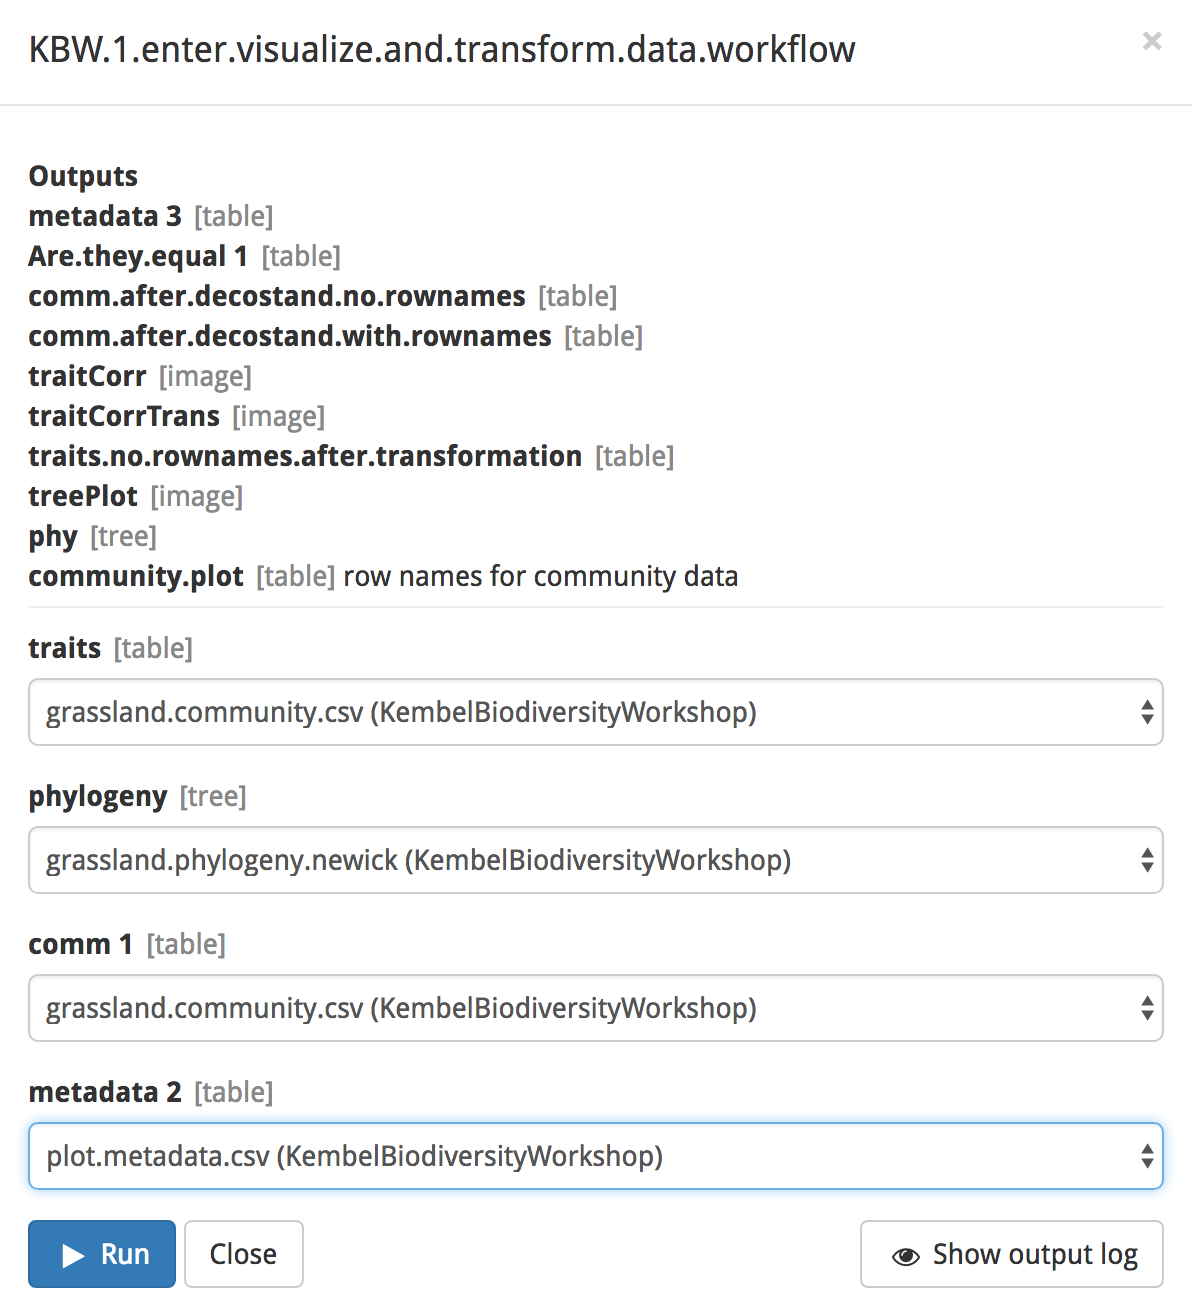
Next, click on the blue ‘Set up and run’ button. You will see a popup box listing the outputs of the modules in your workflow. Note the gray text next to the output; it denotes the format of the output. For example, treePlot’s output will be formatted as an image. At the bottom of the box, select the input files
- ‘species.traits.csv (KembelBiodiversityWorkshop)’ for traits
- ‘grassland.phylogeny.newick (KembelBiodiversityWorkshop)’ for phylogeny
- ‘grassland.community.csv (KembelBiodiversityWorkshop)’ for comm
- ‘plot.metadata.csv (KembelBiodiversityWorkshop)’ for metadata
To start the analysis, click the blue ‘Run’ button.
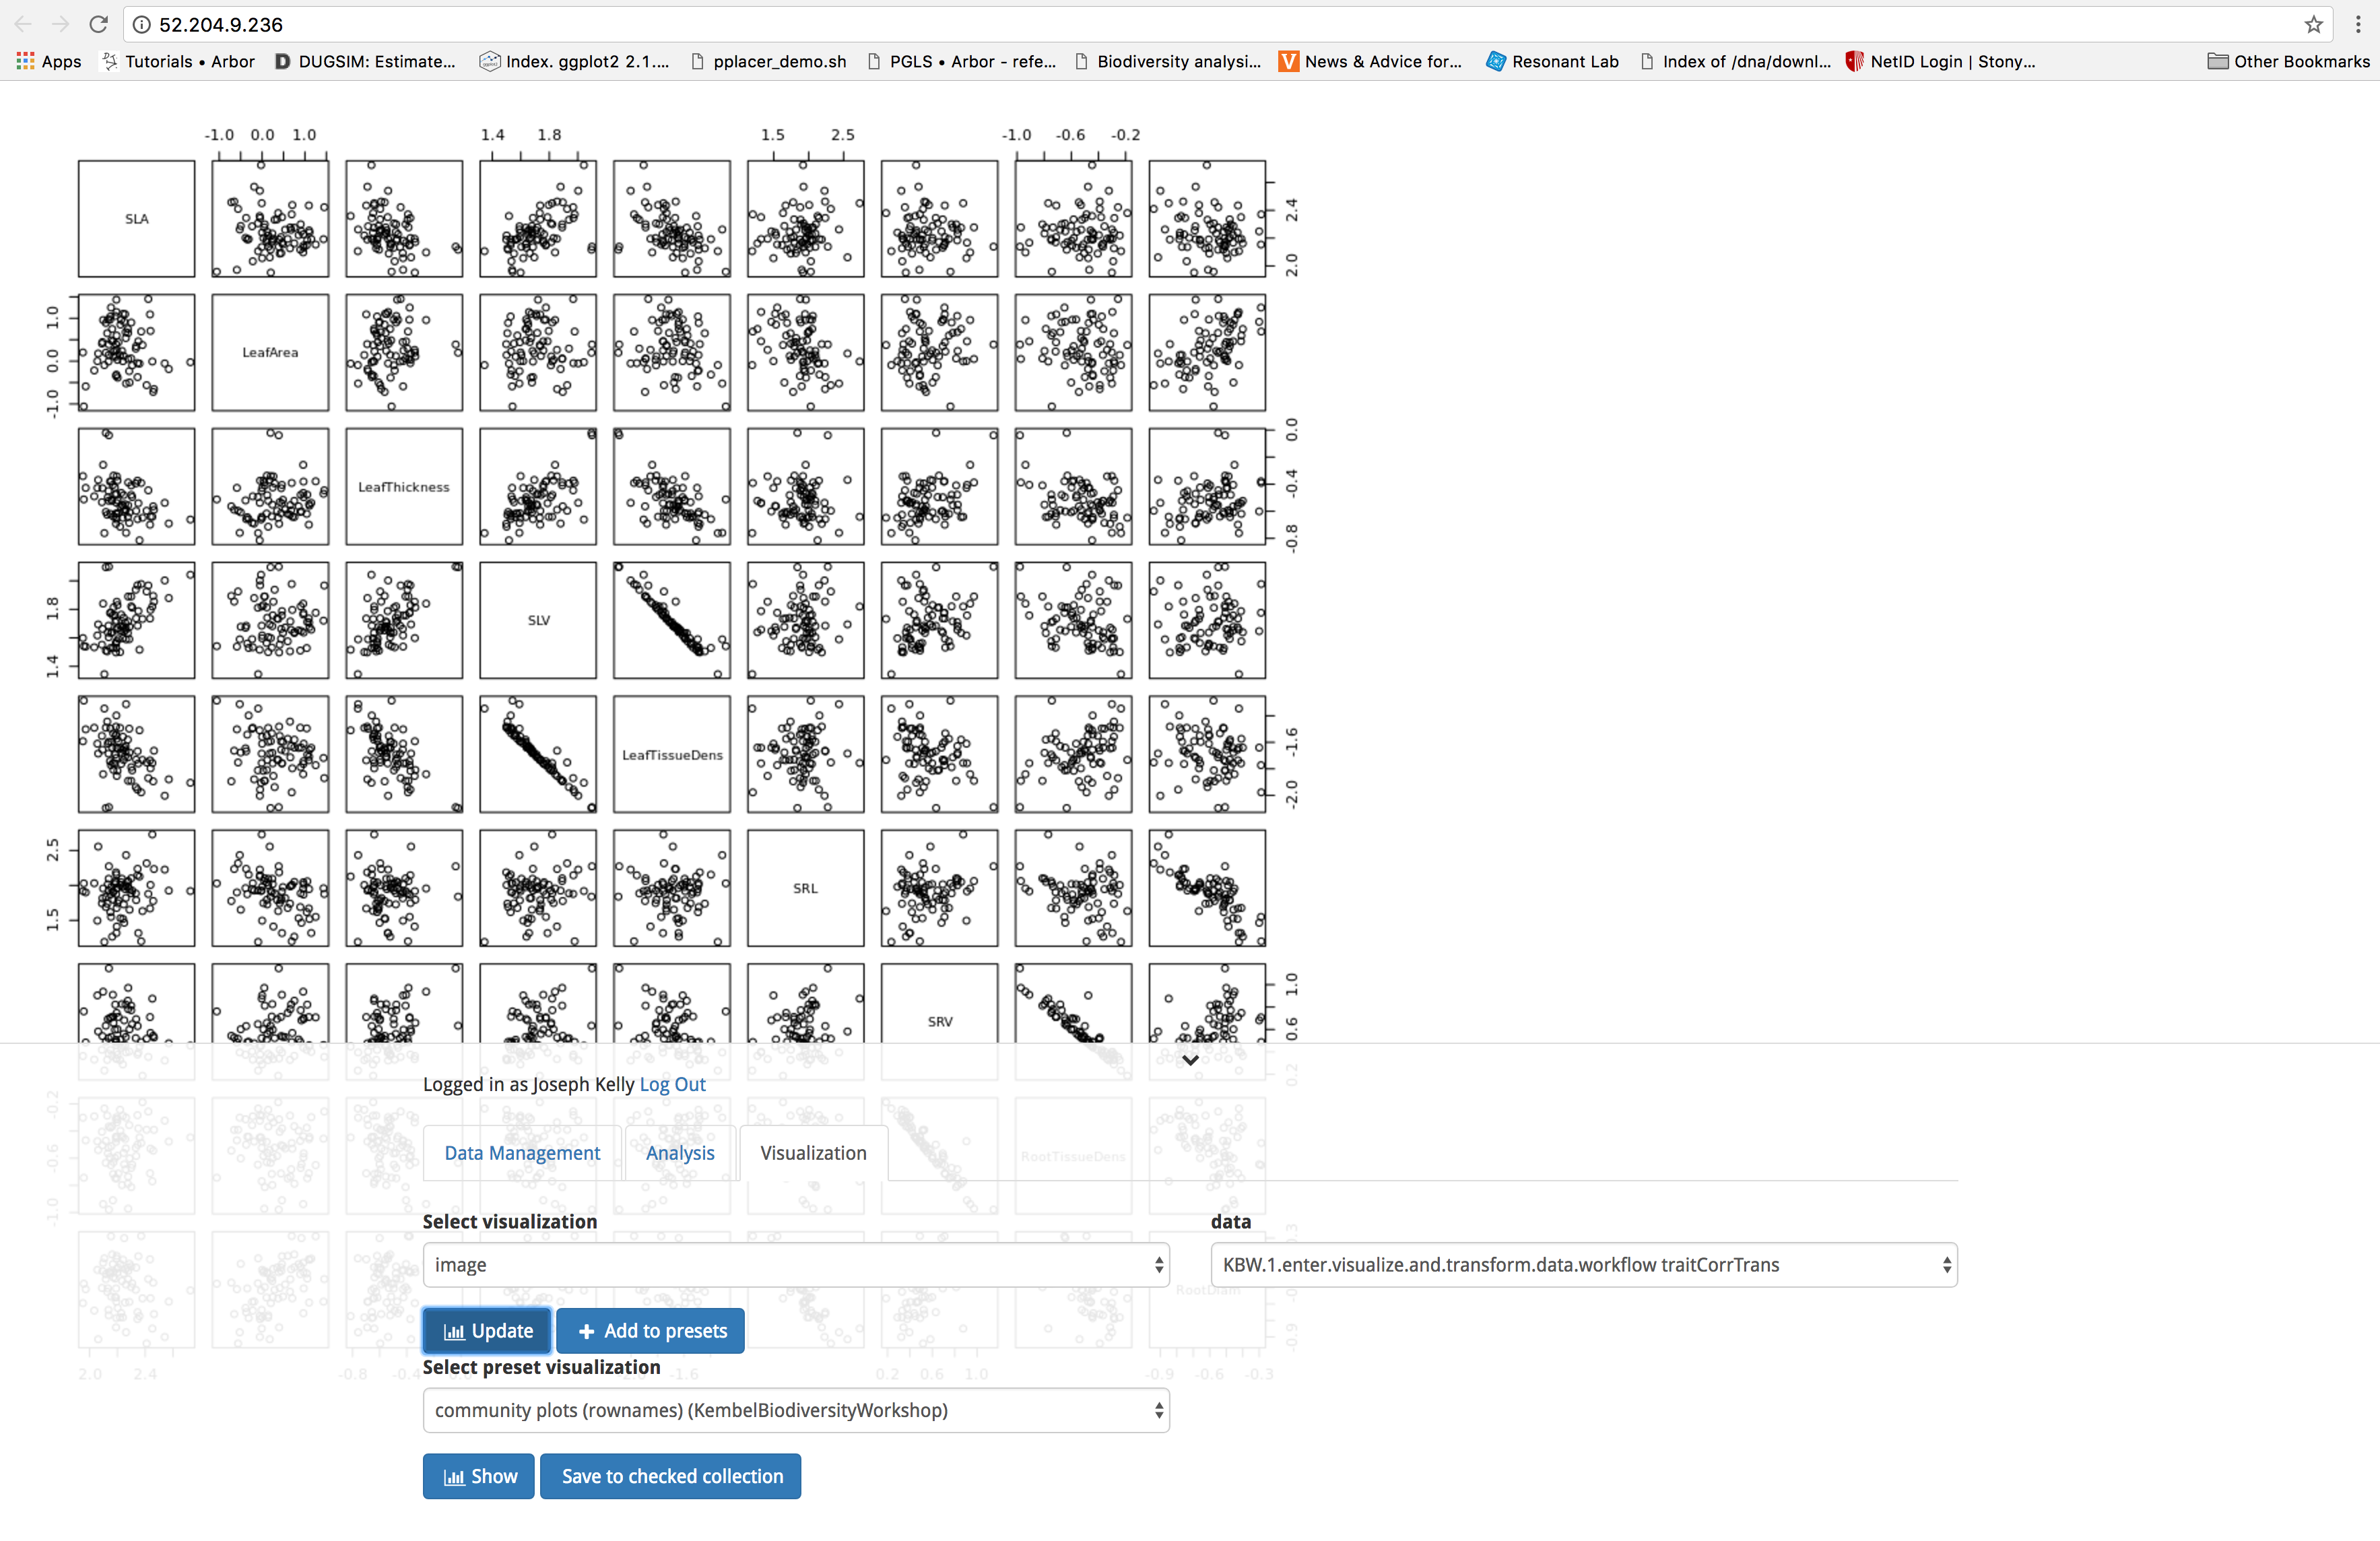
Now let’s have a look at the outputs of our analysis. Outputs can be viewed under the ‘Visualization’ tab. To access a given output, select the class of output from the dropdown menu under select visualization. Next, pull up the output you wish to view from the dropdown menu under data. Finally, click on the blue ‘Update’ button. You can click the downward pointing chevron to the right of your login information to collapse the interface to get an unobstructed view of your output. Clicking on this arrow a second time returns the interface to the screen. Let’s have a look at the transformed data produced by the workflow.
To download the output, return to the ‘Data Management’ tab and scroll to the bottom of the screen. Under Save or download data you are able to select your output from the drop down menu. Next, select the desired file format (.png or .jpeg for images such as our plots), and click the blue ‘Download’ button.
You will need to save intermediate data files to your Arbor directory to continue using them. For this tutorial, be sure to save these files into the directory called ‘KembelBiodiversityWorkshop’
- ‘KBW.1.enter.visualize.and.transform.data.workflow metadata 3.csv’
- ‘KBW.1.enter.visualize.and.transform.data.workflow comm.after.decostand.no.rownames.csv’
- ‘KBW.1.enter.visualize.and.transform.data.workflow comm.after.decostand.with.rownames.csv’
Run the visualizing and summarizing biodiversity data workflow
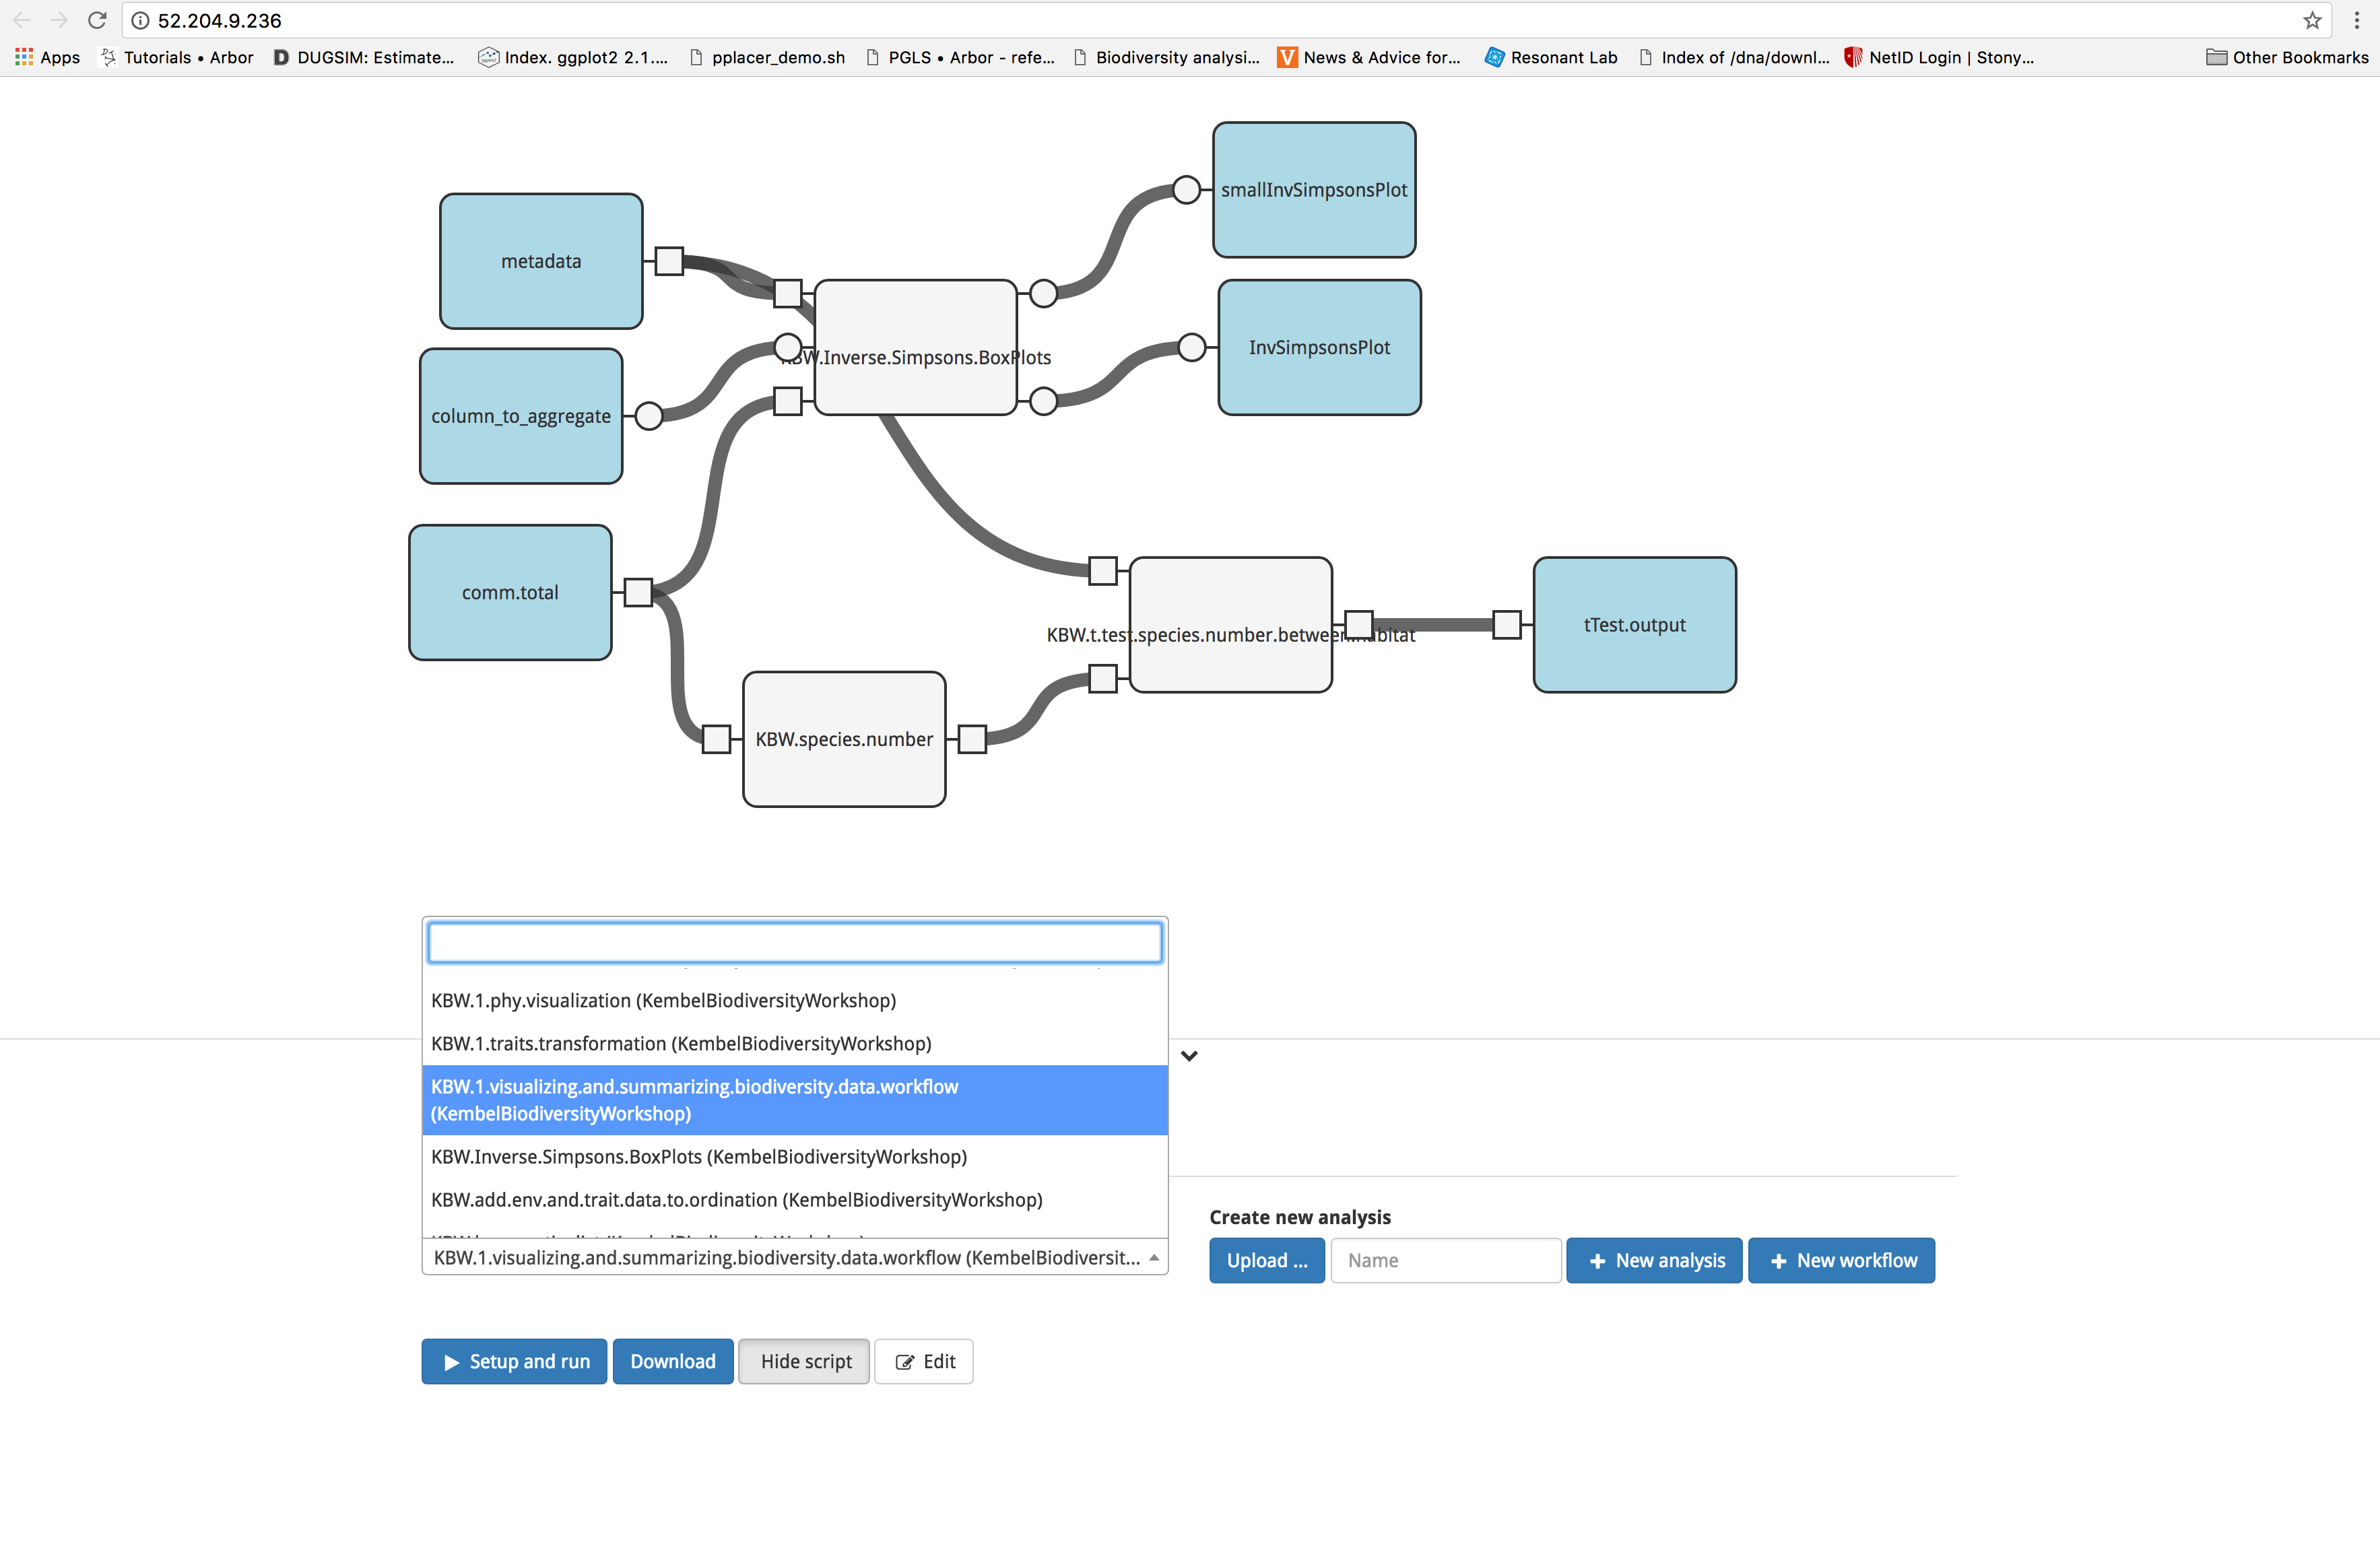
This workflow allows the user to run preliminary analyses to describe differences in biodiversity between habitats. The workflow is accessed and initiated in the same manner as before. Start by clicking the ‘Analysis’ tab, then select ‘KBW.1.enter.visualizing.and.summarizing.biodiversity.data.workflow (KembelBiodiversityWorkshop)’ from the dropdown menu.
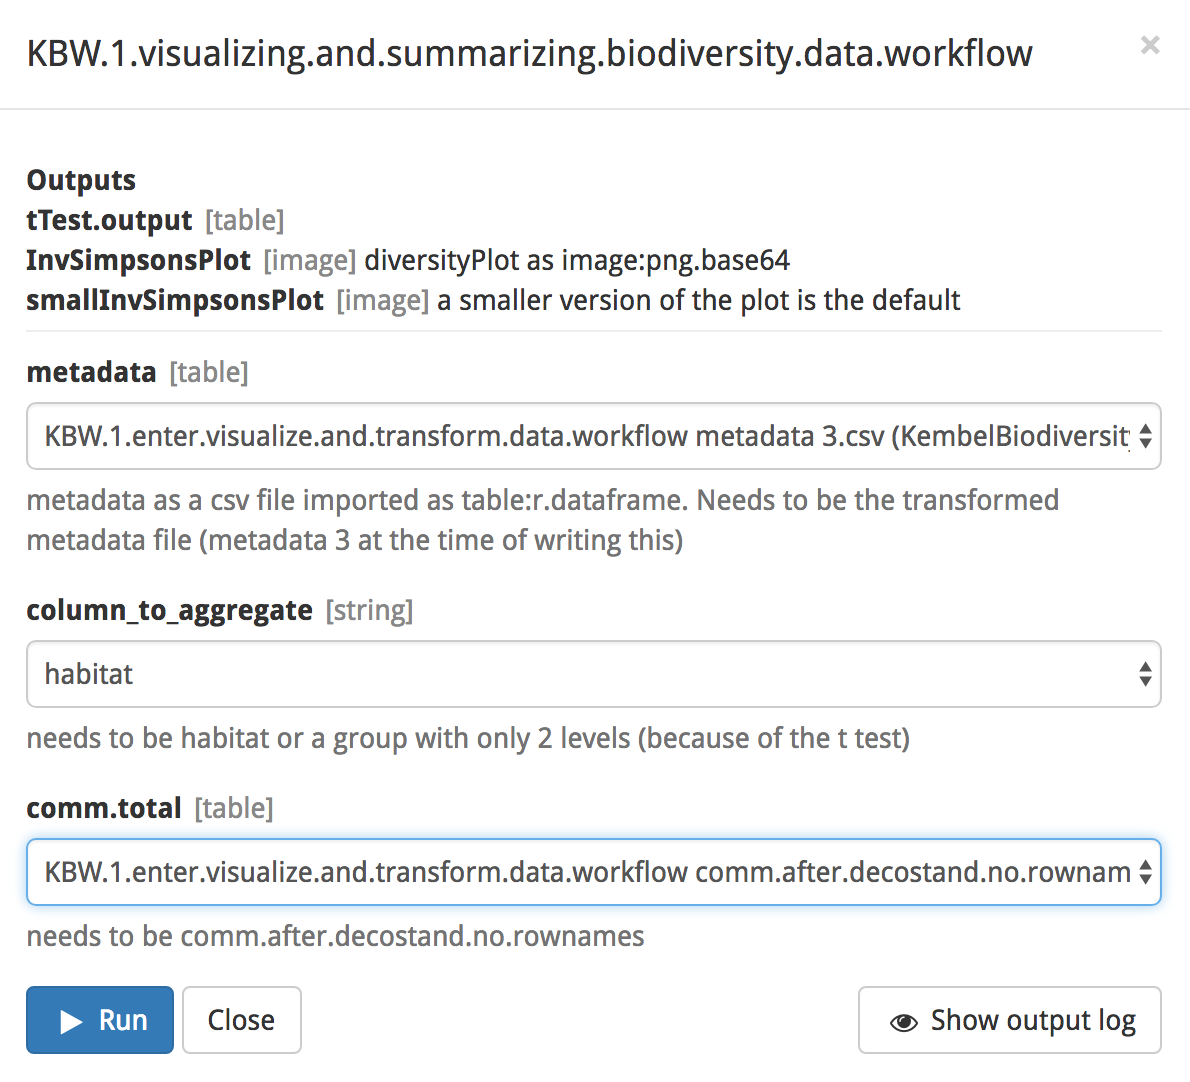
Proceed by clicking on the blue ‘Set up and run’ button and selecting the input files. For this analysis, we will be using files produced by the data visualization and transformation workflow. These files contain data that have been normalized and reformatted to fit the functions contained in Arbor. Select ‘KBW.1.enter.visualize.and.transform.data.workflow metadata 3.csv (KembelBiodiversityWorkshop)’ for metadata and ‘KBW.1.enter.visualize.and.transform.data.workflow comm.after.decostand.no.rownames.csv (KembelBiodiversityWorkshop)’ for comm.total. The input column_to_aggregate draws its selection from the metadata file and contains several choices. For this tutorial, select ‘habitat’. Finally, click the blue ‘Run’ button.
Our analysis has performed a t-test on the number of species between habitats and plotted the inverse Simpson’s index by habitat. The outputs of this analysis can be visualized in the same fashion as above. Under the ‘Visualization’ tab select a class of output from the dropdown menu under select visualization, then select the desired output under data. Finally, click on the blue ‘Update’ button.
Run the multivariate community analysis workflow
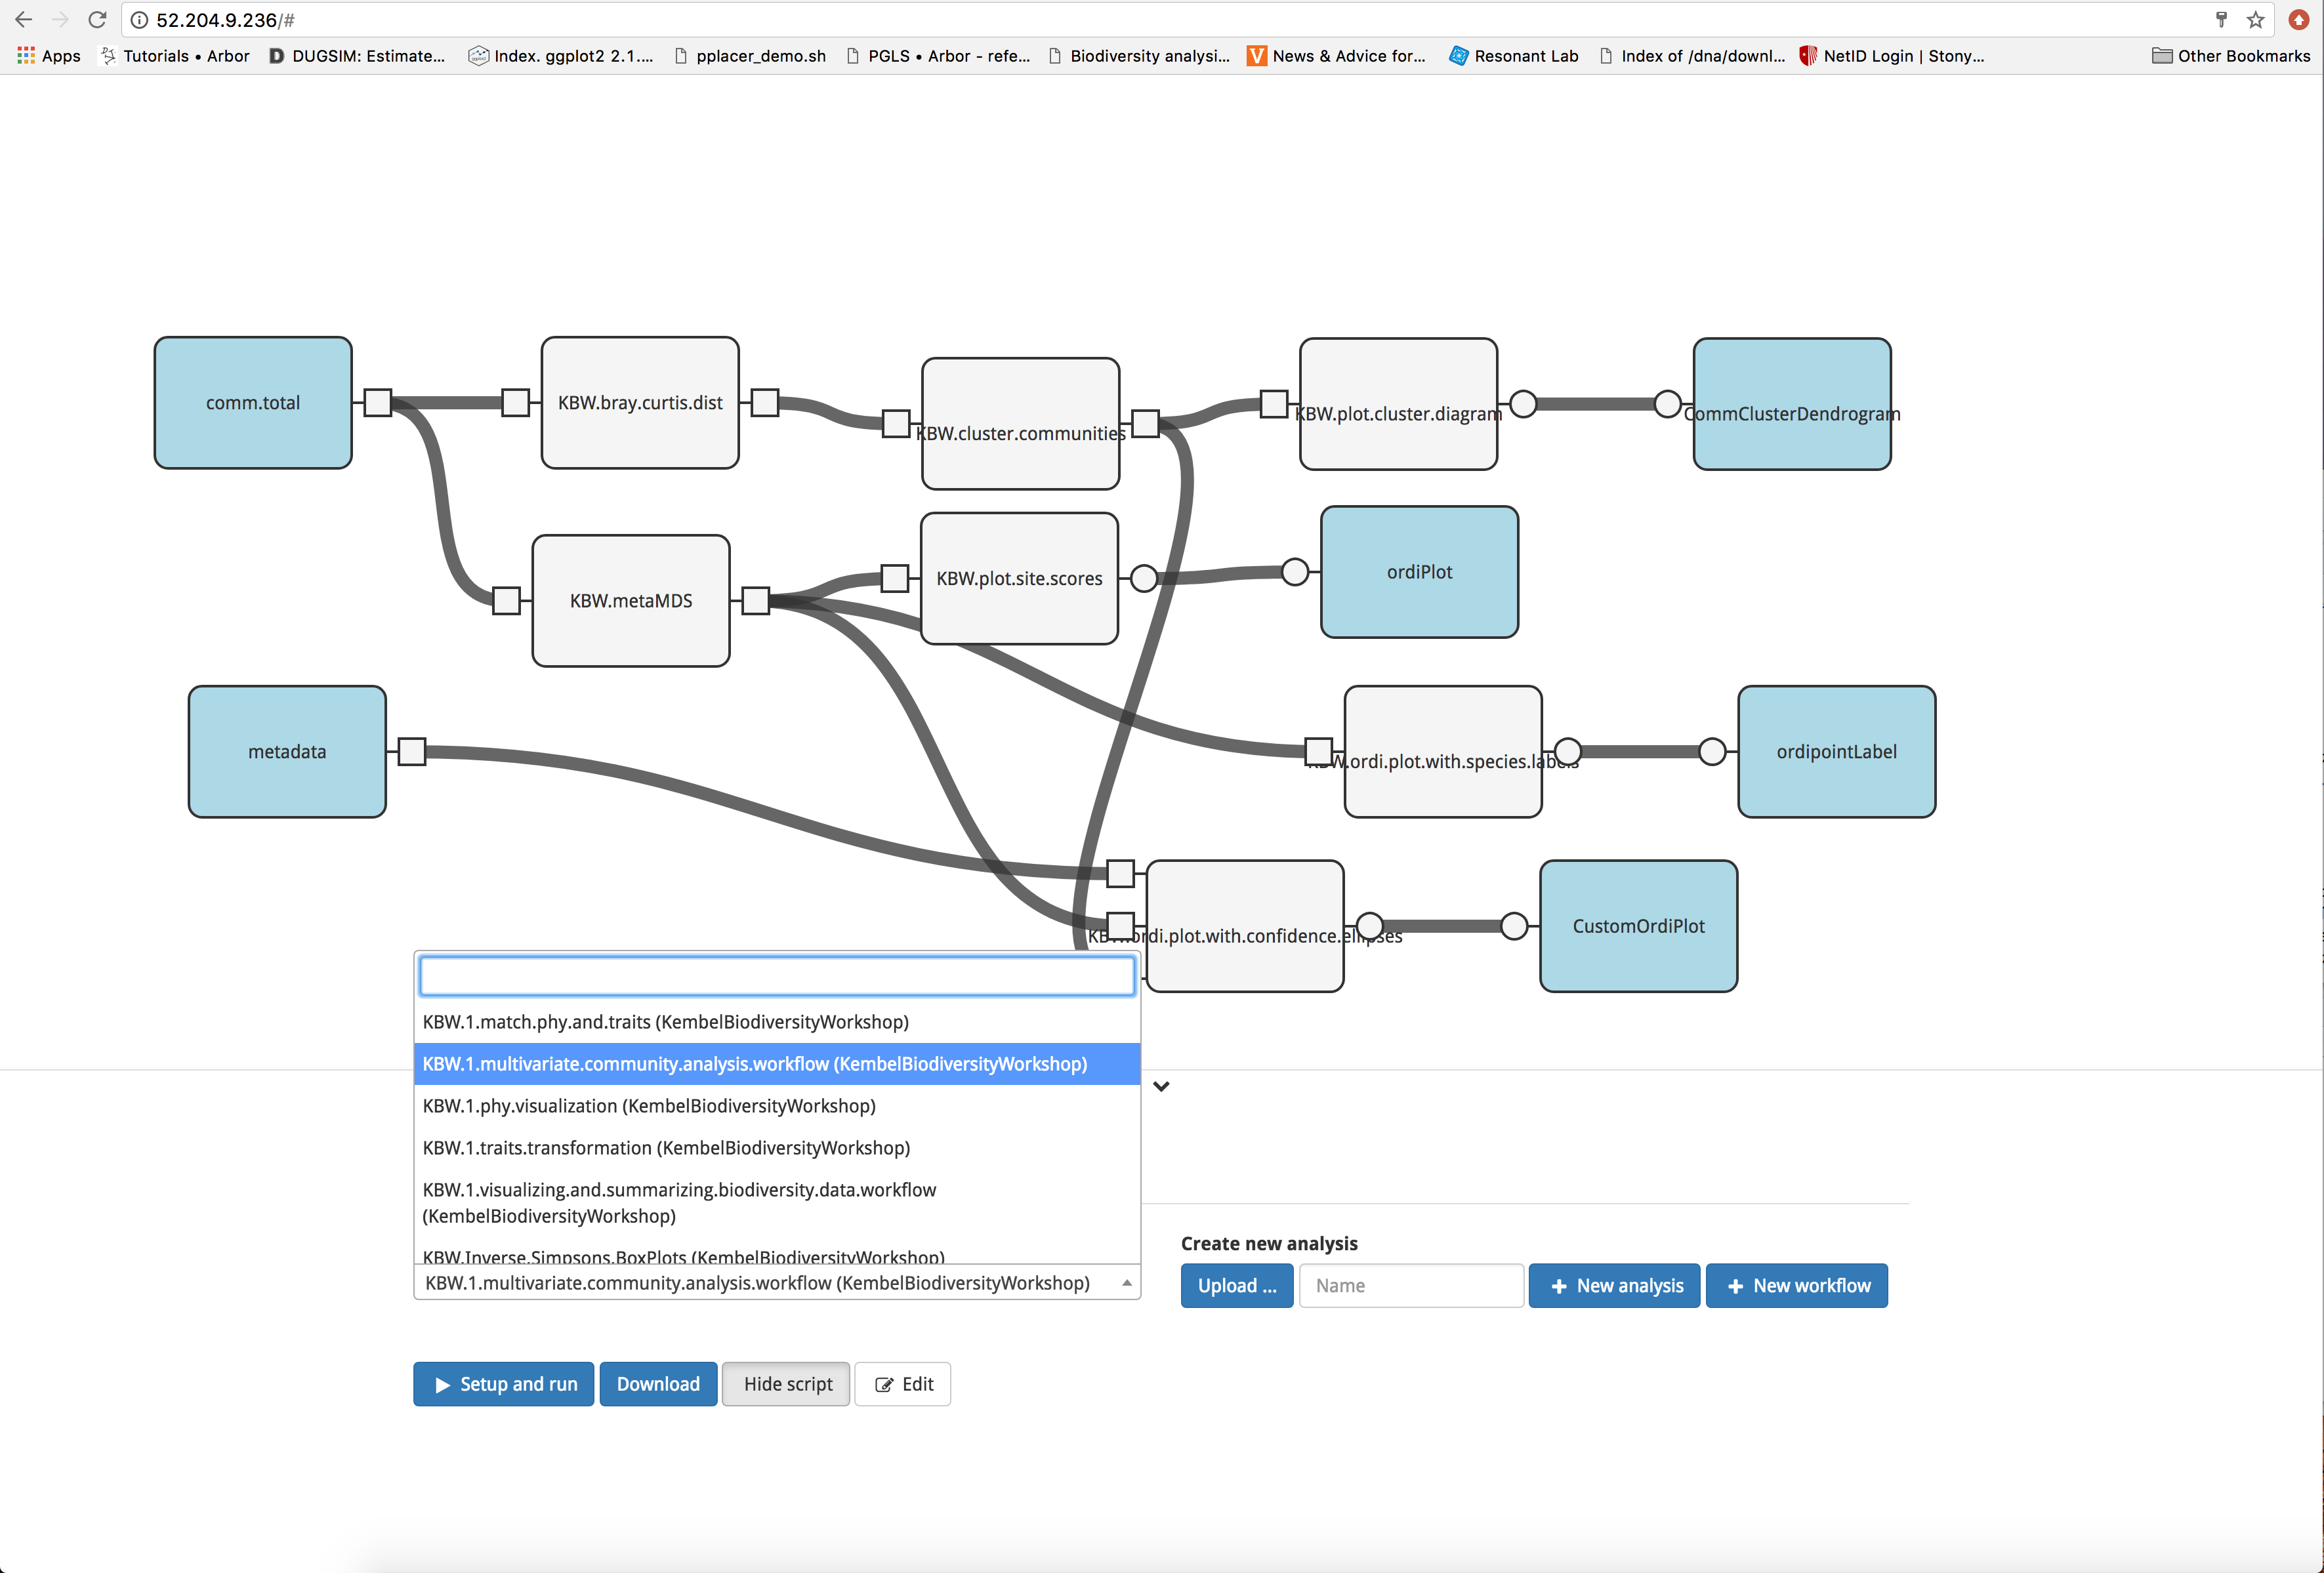
We may also be interested in performing multivariate analyses on our data. To begin, access the multivariate community analysis workflow by clicking the ‘Analysis’ tab and selecting ‘KBW.1.multivariate.community.analysis.workflow (KembelBiodiversityWorkshop)’ from the dropdown menu.
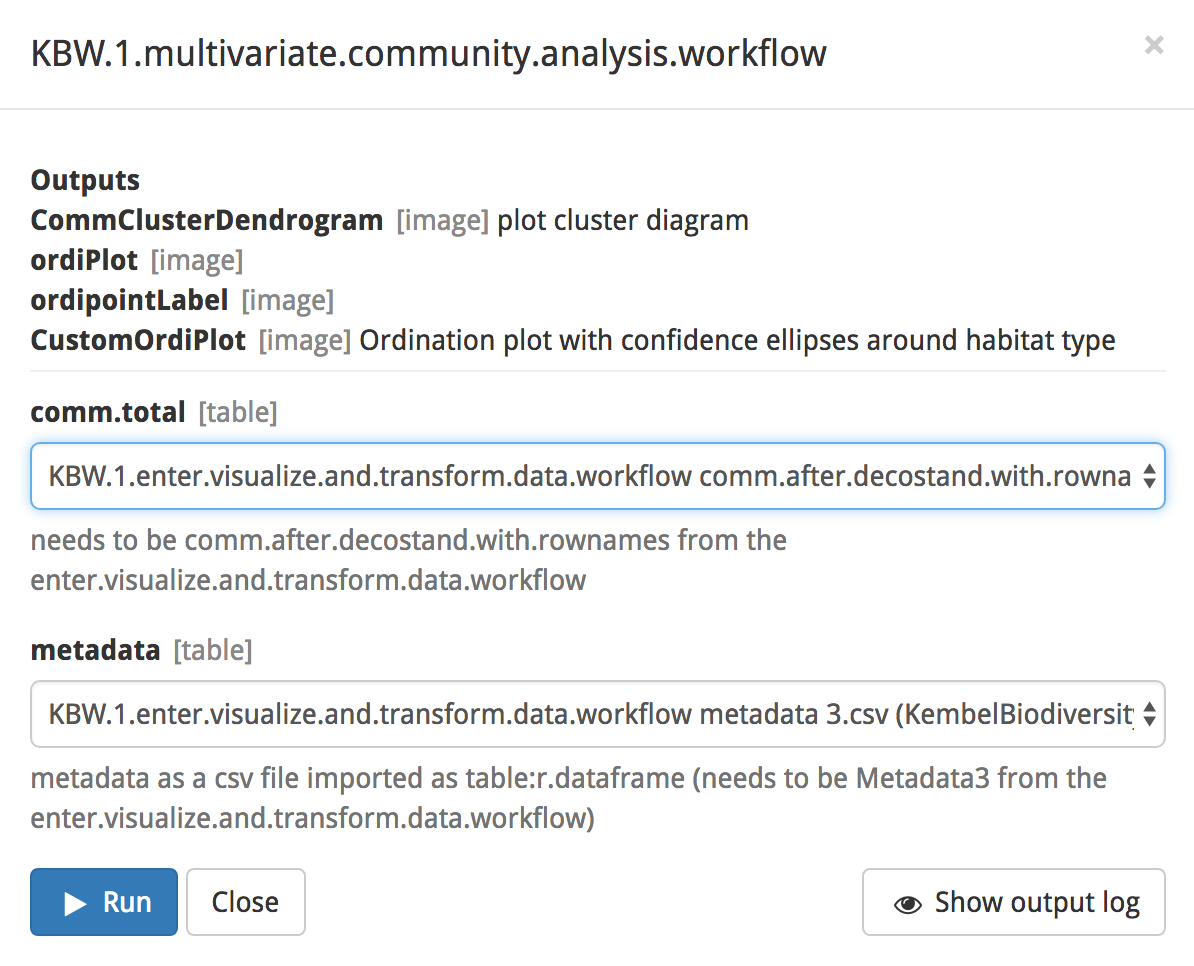
Next, click the blue ‘Set up and run’ button and select the input files. As before, this analysis is formatted to accept the files produced by the data visualization and transformation workflow. Select ‘KBW.1.enter.visualize.and.transform.data.workflow comm.after.decostand.with.rownames.csv (KembelBiodiversityWorkshop)’ for comm.total and ‘KBW.1.enter.visualize.and.transform.data.workflow metadata 3.csv (KembelBiodiversityWorkshop)’ for metadata. Initiate the analysis by clicking the blue ‘Run’ button.
The outputs of this analysis can be visualized as before. Under the ‘Visualization’ tab select a class of output from the dropdown menu under select visualization, then select the desired output under data. Finally, click on the blue ‘Update’ button.
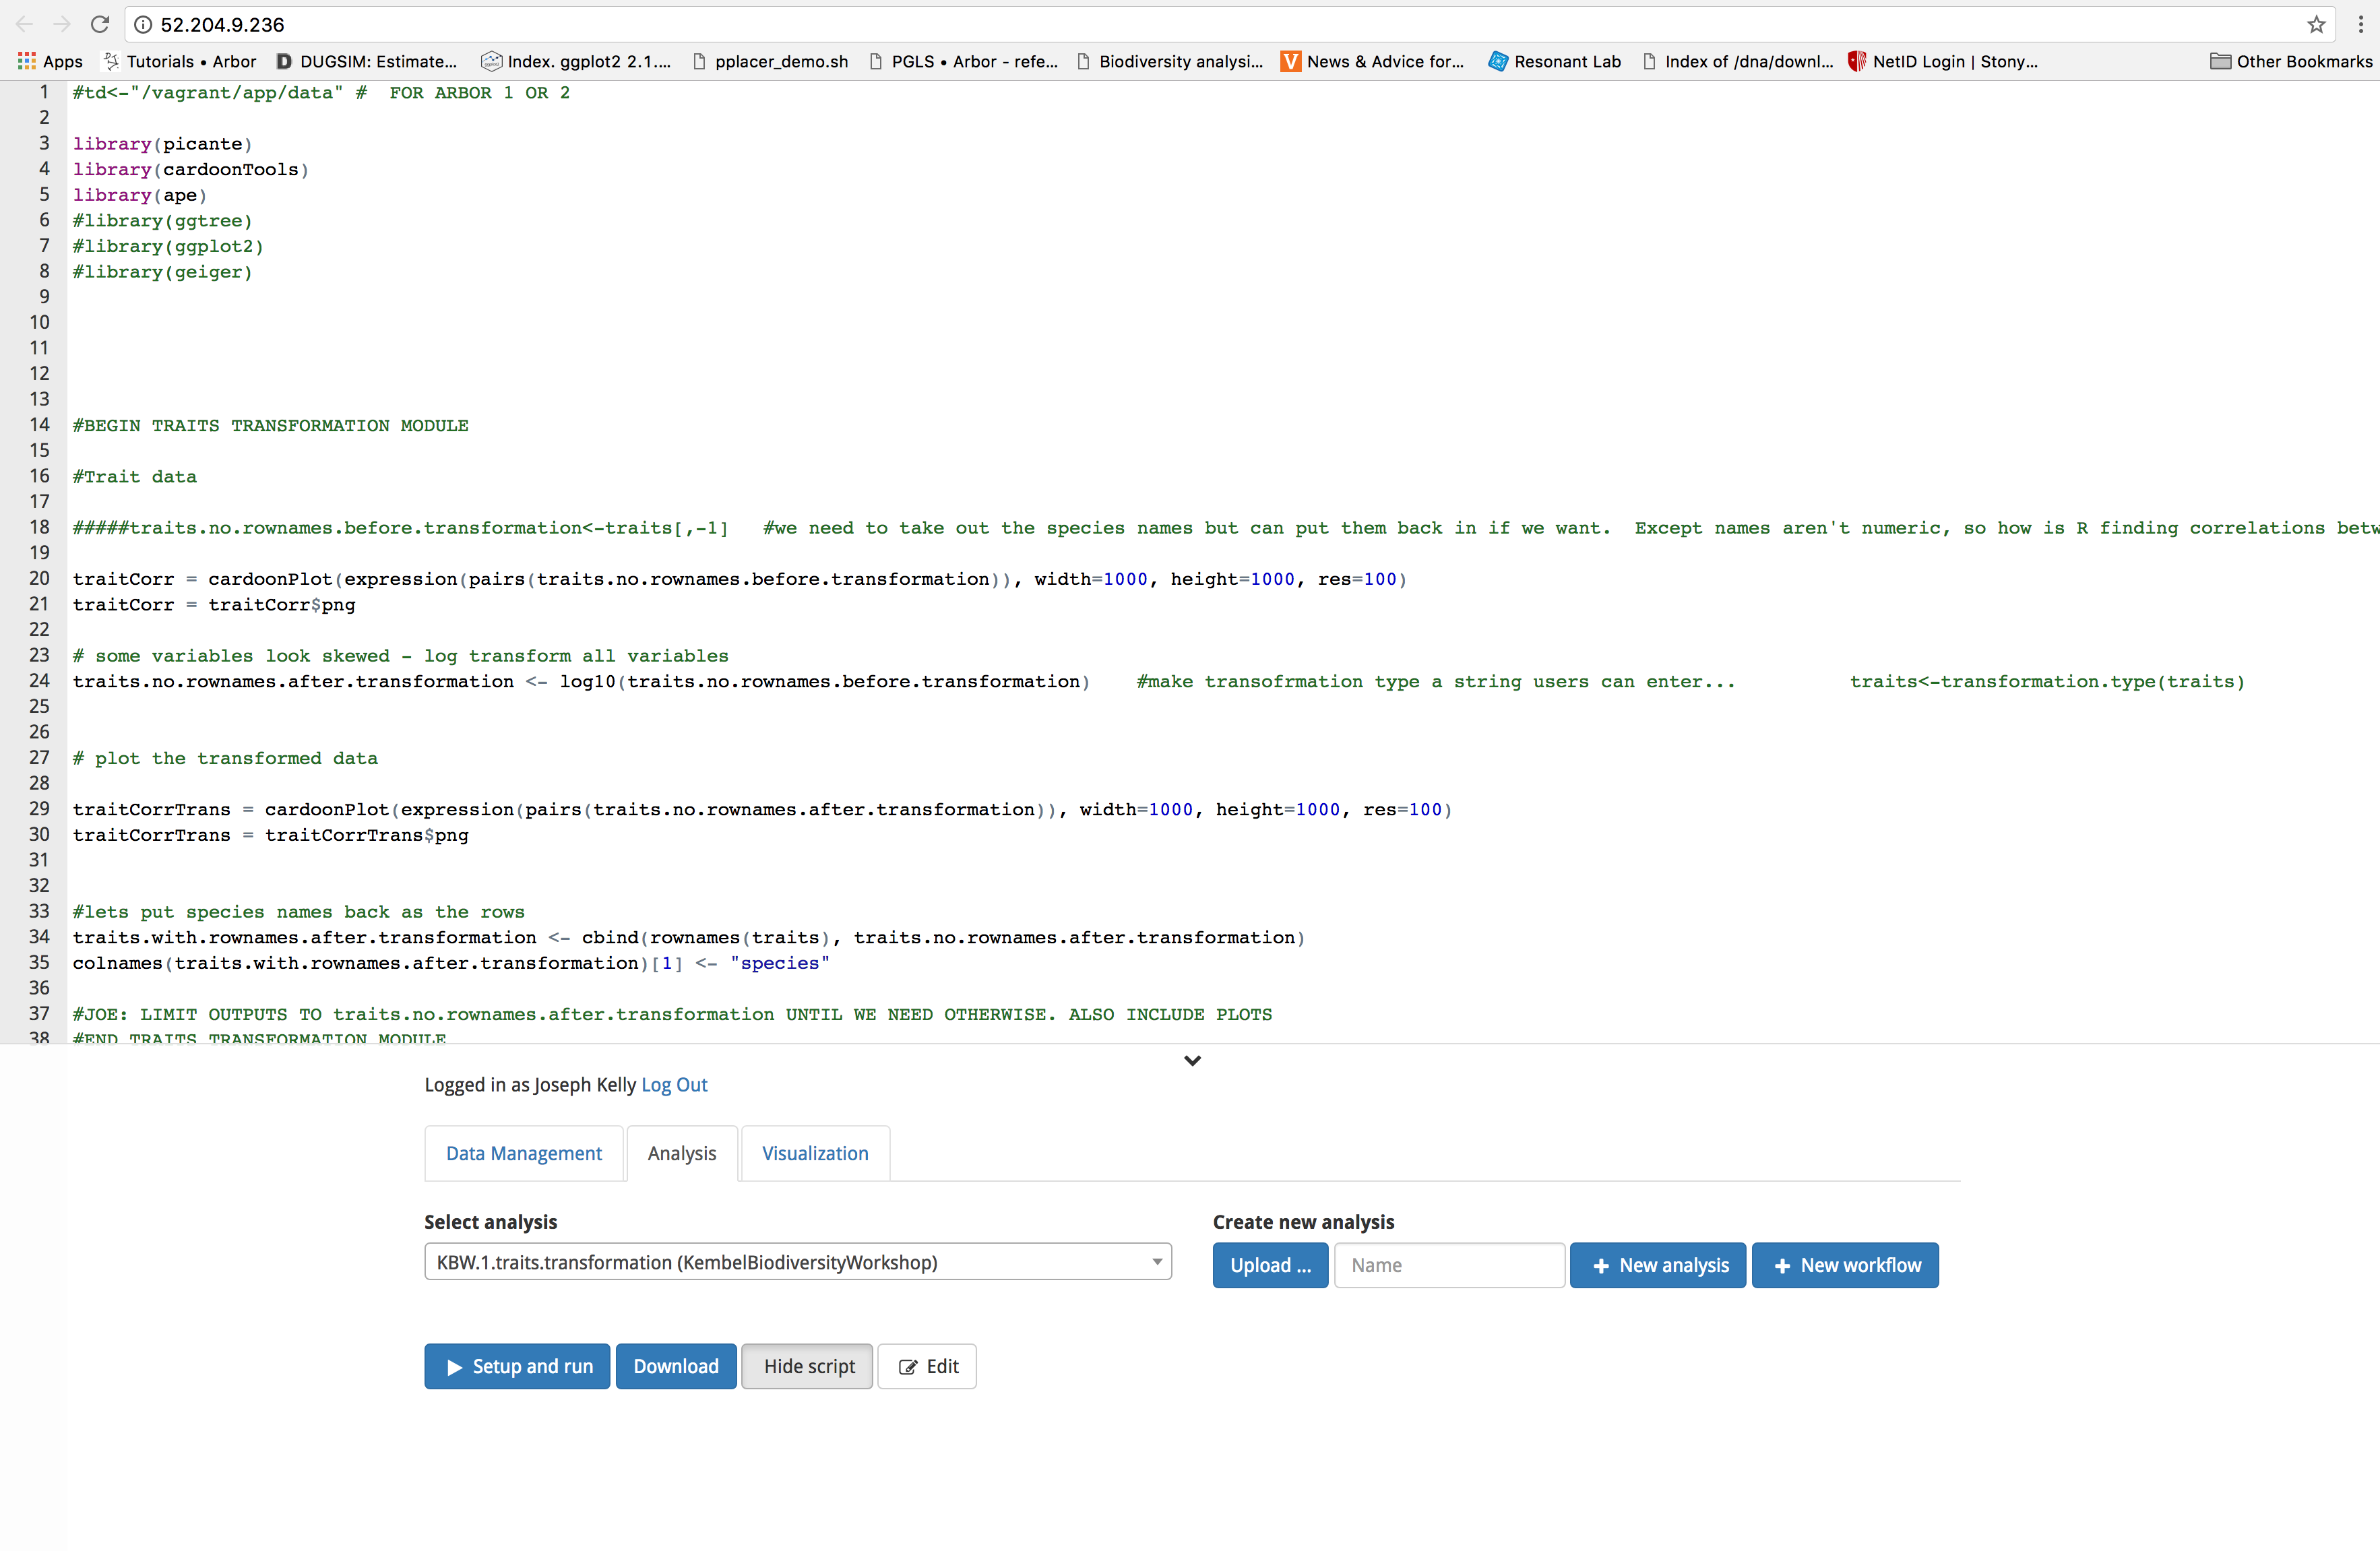
Examine the R scripts for each module
Arbor workflows are constructed using modules that can be assembled as needed to fit the specific needs of your analysis. To view the script for a module, click the ‘Show script’ button under the analysis tab. You can also choose to download the module as a .json file by clicking on the blue ‘Download’ button.