What are Arbor apps?
As a part of the Arbor project, we are developing a few simple-to-use web apps that allow users to quickly and easily carry out a few of the most common comparative methods. These pages present a drag-and-drop interface to test for phylogenetic signal, reconstruct ancestral character states, test for character correlations, and other common analyses.
What can I do in Arbor apps?
To use an Arbor app, you can navigate to our app index.
Walkthrough - Phylogenetic Signal Arbor app
Let’s walk through one example analysis in an Arbor app. We will work on testing for phylogenetic signal. I will use two data files for Anolis lizards, linked below.
- anolis.phy: a phylogenetic tree of anoles
- anolis.csv: character data for anoles (comma-separated format)
Download these two files, and locate them on your computer’s file browser.
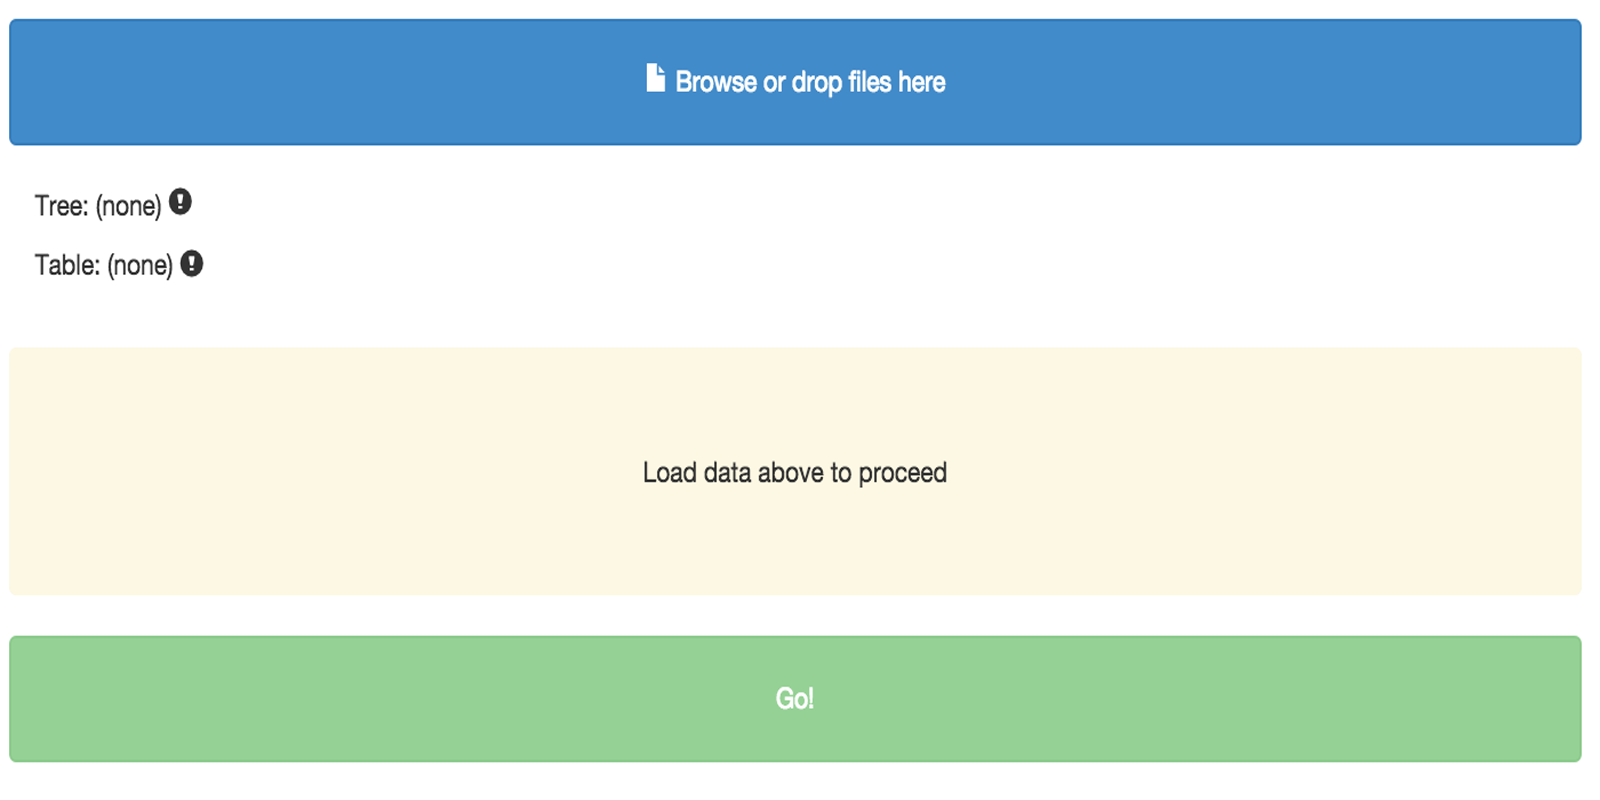
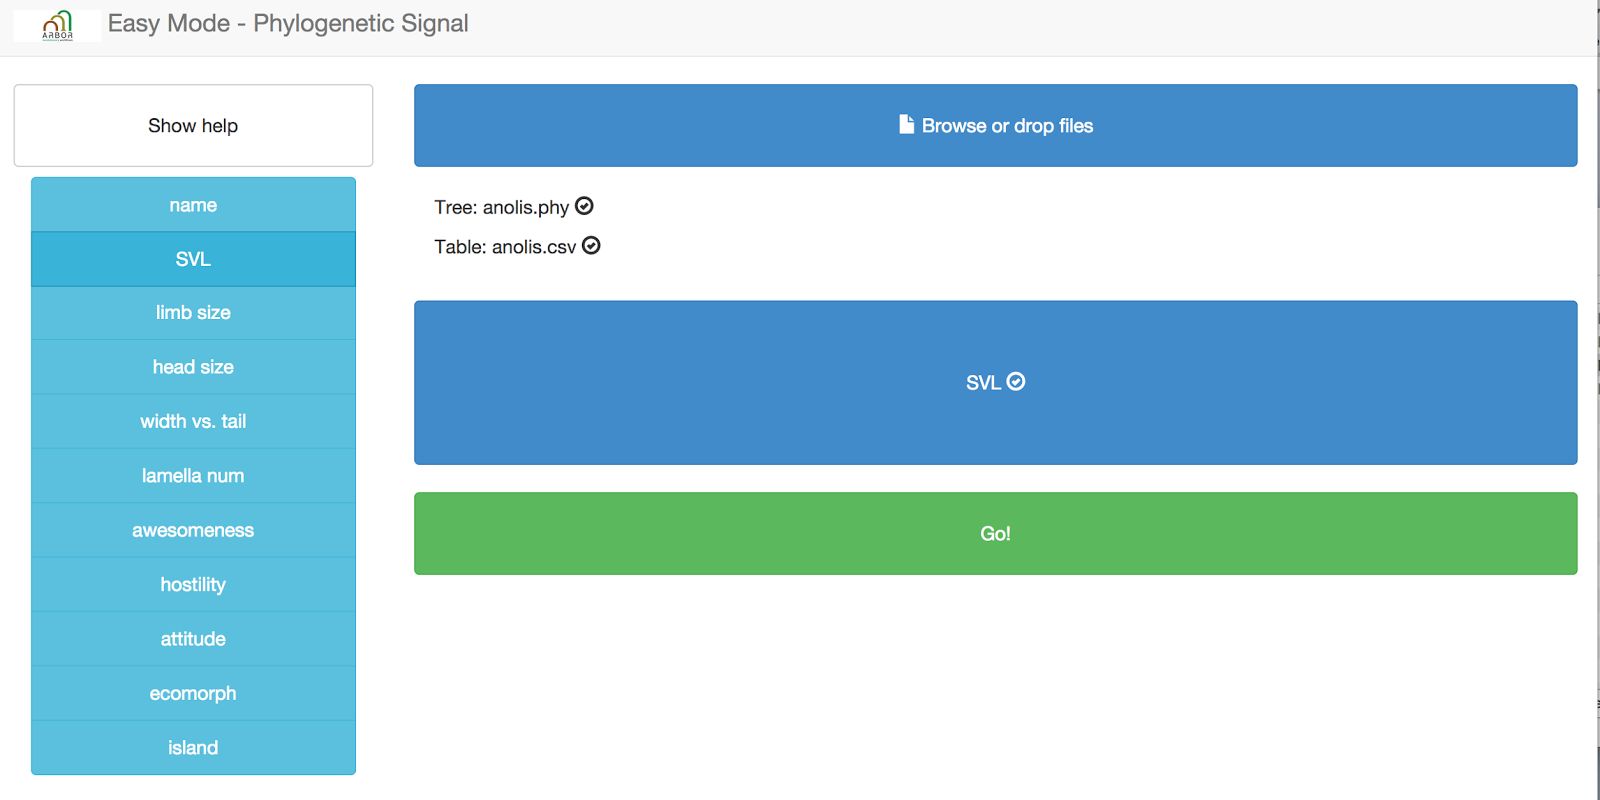
Now, navigate to the Arbor app for phylogenetic signal. You should see something like this:
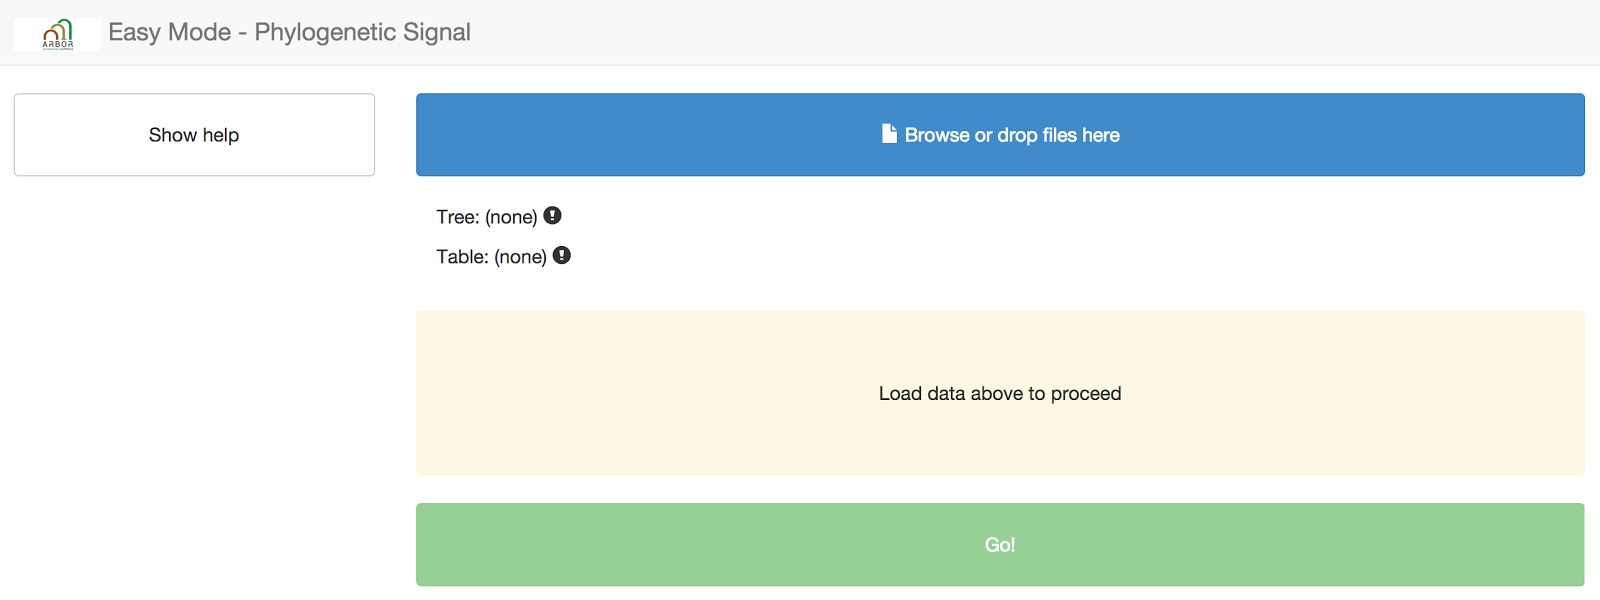
Next, you need to input your datafiles into the website. You can do that by dragging and dropping the files onto the blue box that says “browse or drop files here.”
When you hover over the correct place, the box will turn green. Arbor can automatically detect whether you have uploaded a tree or a data file.
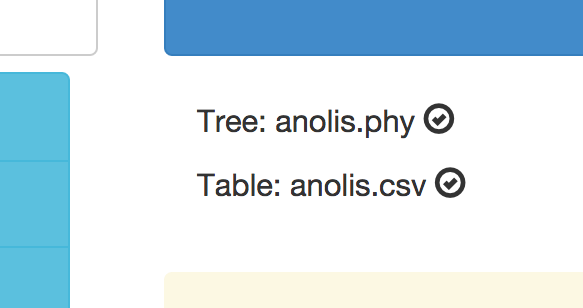
After you upload both files, you should see them listed in the appropriate place, like this:
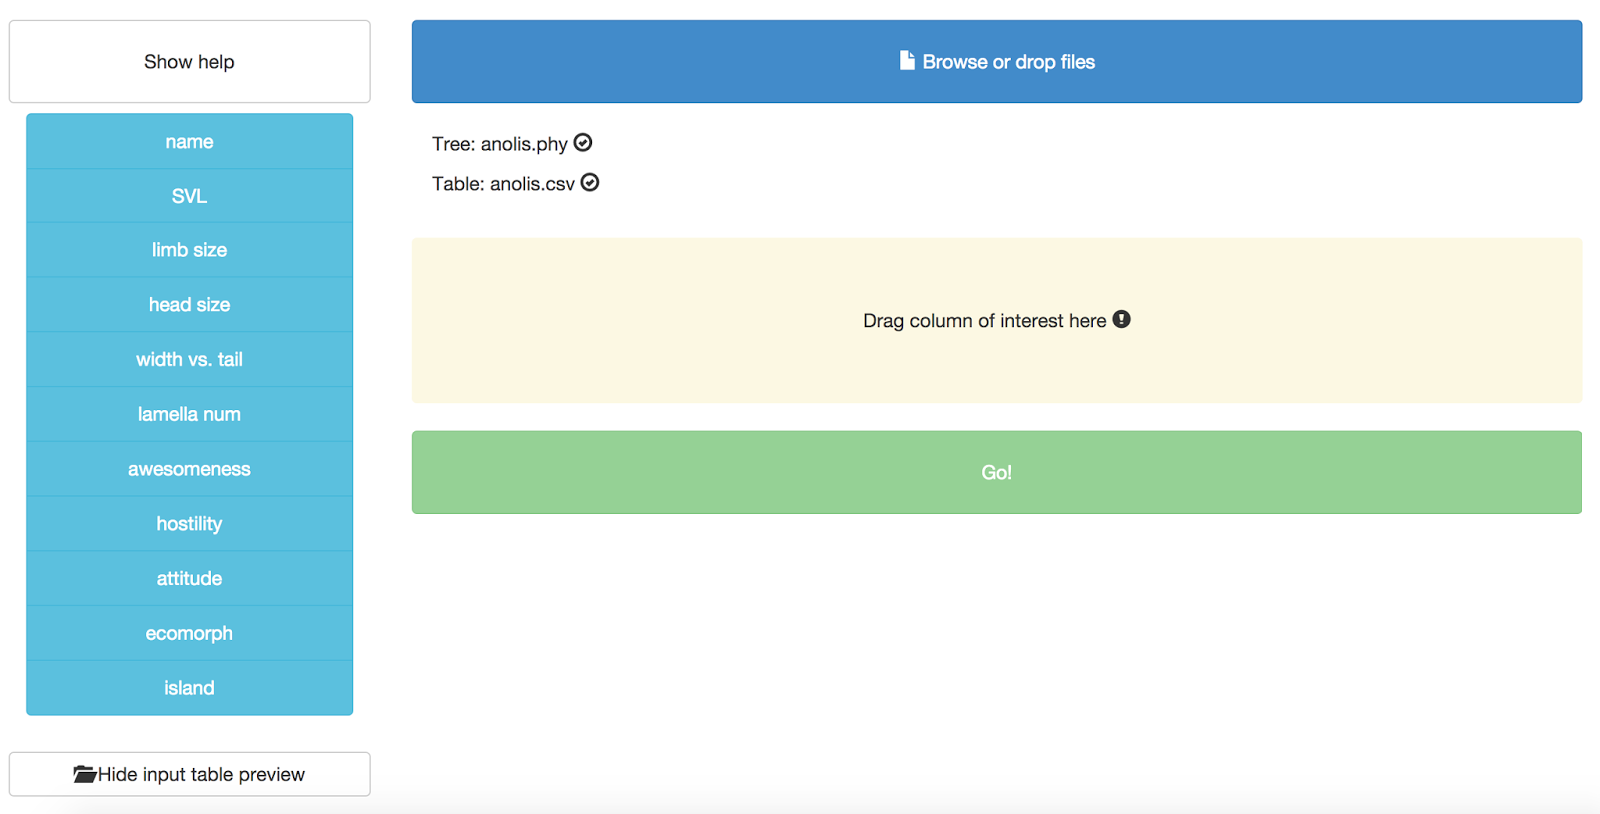
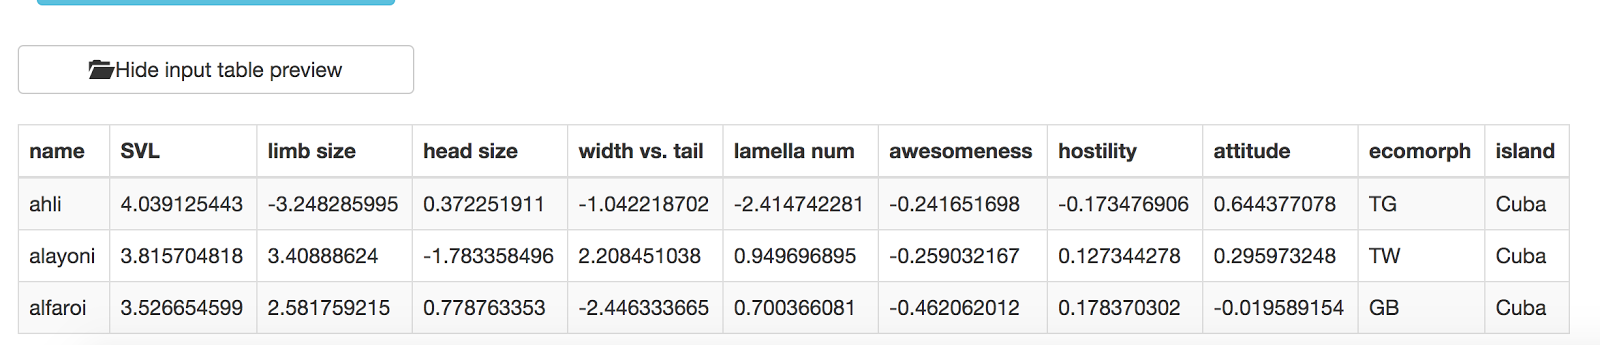
You might also notice that you can see a preview of your input table at the bottom of the page:
Now you need to specify a column that will define the trait that you want to use for the phylogenetic signal test. Right now, this test can only handle one trait at a time! Let’s choose “SVL.” Grab that column name from the left hand side and drag and drop it onto the box that says “Drag column of interest here.” You should end up with this:
No just press “Go!” and your analysis will run. You should get back a table of results, like this:
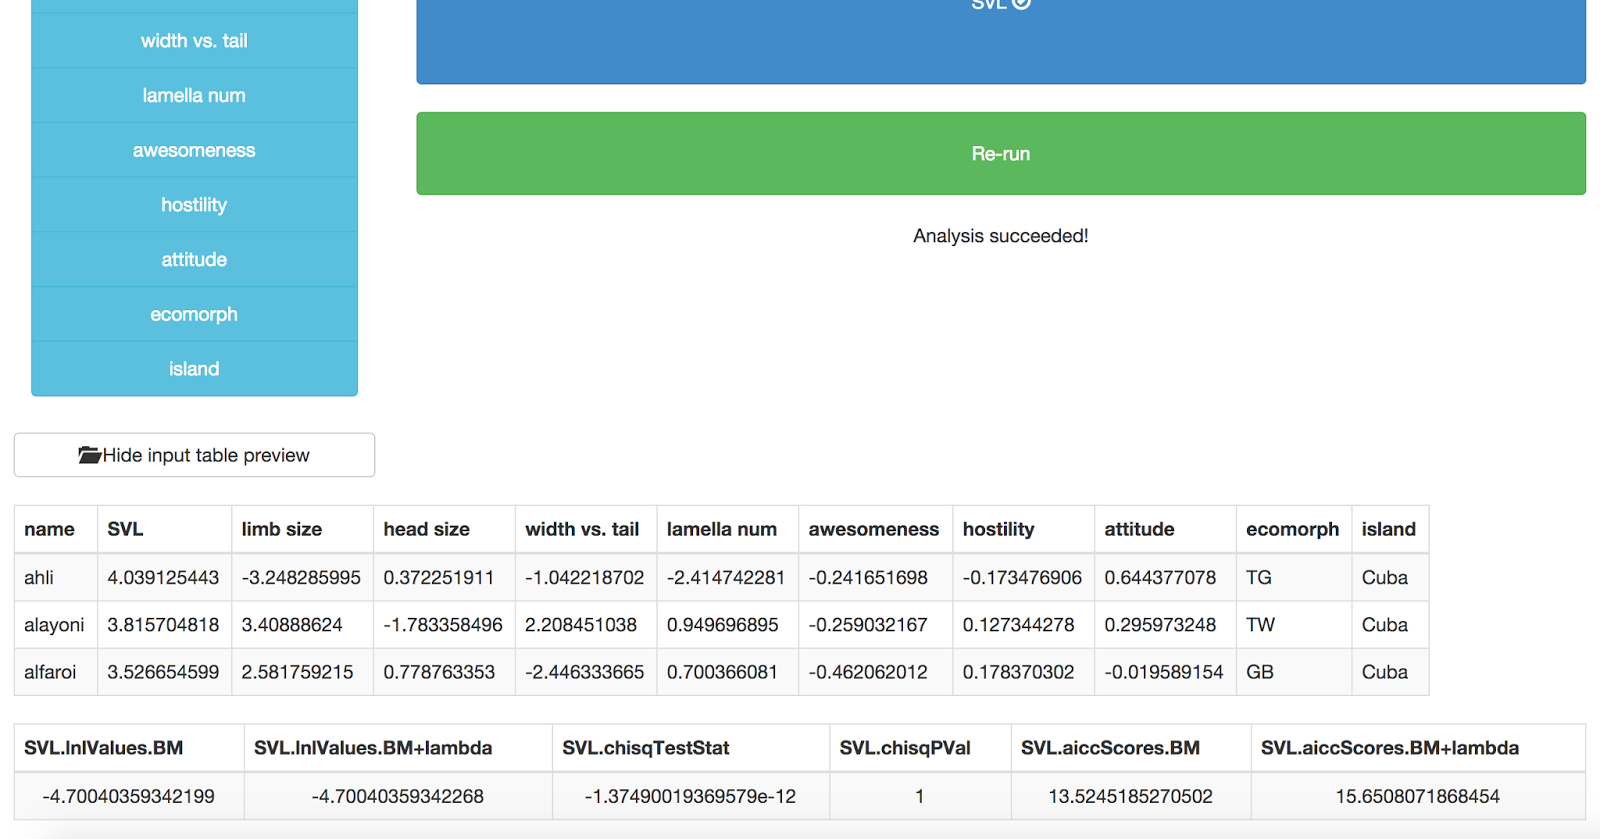
The last table shows the results of the analysis. The first two columns are the likelihoods of a Brownian motion model and Brownian motion + lambda. The third and fourth represent a chi-squared test comparing a “full” phylogenetic signal model (Brownian motion) with a model where signal is less than Brownian motion (lambda). P < 0.05 means that you can reject BM in favor of the lambda model. The last two columns show AICC scores for these two models. This output is formatted in a very confusing way, we are going to fix it!